Location Diligence Report
Everything the market data says about one car wash site — capacity by format, a complete competitor census with pricing and damage intelligence, the supply that's coming, and the economics — in one report a lender or partner can actually read.
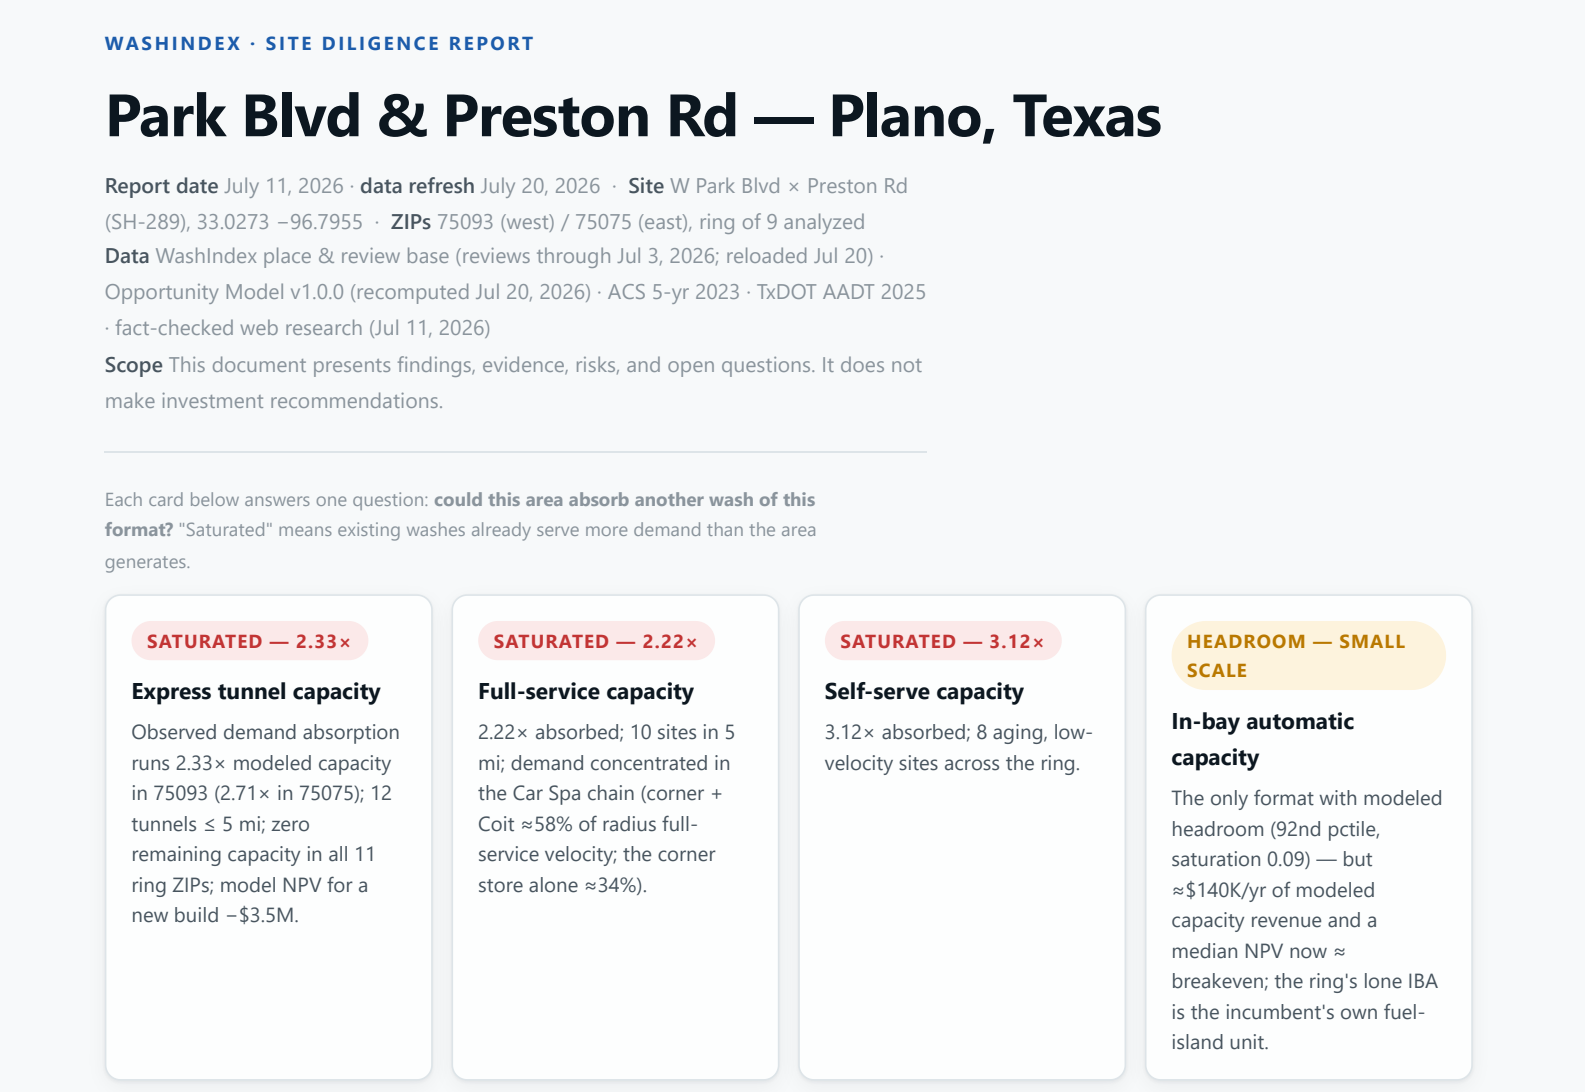
From the sample report: format-by-format capacity verdicts for a contested Plano, TX corner.
Twelve sections, four core answers
Every report follows the same 12-section standard — capacity findings, site, demographics, traffic, climate, competition, capacity & saturation model, financials, real estate, regulatory, risks, open items — so any two sites read side by side.
Capacity verdicts by wash format
Our capacity model's read on the trade area, format by format — express tunnel, full-service, in-bay, self-serve: observed demand vs modeled capacity, remaining unserved demand, and model NPV context, each graded with a confidence tier.
The complete competitive picture
Every wash within five miles censused: review velocity, pricing ladders, membership lock-in, and AI-read damage-claim rates from thousands of reviews — plotted on a site map over the traffic network.
Permit-level supply pipeline
State construction filings and city planning records reveal the washes that don't exist yet — who's building, where, and when they open — alongside fact-checked research on zoning, utilities, traffic, real estate, and demographics.
Sensitivity model, risks & open items
An interactive pro forma calculator embedded in the report — test your own member, pricing, and capex assumptions — plus a ranked risk register and the open diligence questions with the artifact that answers each. Findings and evidence only; no investment recommendations.
Order to inbox in 3 business days
Send us the site
Order with a street address or intersection — an existing wash, a land parcel, or a corner you're evaluating. US sites get full data coverage; international sites are delivered with explicit coverage notes.
We run the full stack
A 20-dataset market extraction around your coordinates, the capacity model scored for every wash format, and nine web-research memos — zoning, permits, real estate, traffic, demographics, utilities — each adversarially fact-checked.
Report in 3 business days
You receive a self-contained HTML report in our standard 12-section format — charts, site map, damage table, pipeline table, and the live calculator. Open it in any browser; share it with partners, lenders, or your IC.
Order by email with the site's address or intersection. We confirm coverage the same day and send a payment link; the 3-business-day clock starts at payment.
See a real one first
The sample is a complete, real report on a Plano, TX corner: 31 competitors censused, 11,569 reviews AI-analyzed for damage claims, 16 pipeline projects surfaced in the permit sweep, and a working sensitivity calculator. What you see is what you get.
Just need the customer-level view of one wash?
The Customer Catchment Report maps where an existing location's customers actually live, neighborhood by neighborhood — $150 per location.
Method & fine print
Capacity findings come from the WashIndex Opportunity Model: observed demand (review-velocity of every wash in the radius, a public-data proxy for volume) is compared against modeled market capacity built from population, income, traffic, vehicle ownership, and climate. Saturation above 1.0× means existing washes already serve more demand than the area generates. Every model figure carries a stated confidence tier, and every number in the report cites its source — our datasets or a fact-checked public record.
Review velocity is a demand proxy, not revenue; model outputs are estimates, not appraisals or forecasts; unverified claims are labeled as such; and each report carries a full methodology note and legal disclaimer. Reports present findings, evidence, risks, and open questions only — no investment recommendations. The sensitivity calculator reflects only the assumptions its user selects.
Best coverage for US sites; international sites are delivered with explicit data-coverage notes. Not sure your site qualifies? Email us the address and we'll check coverage before you pay.