How to Evaluate Car Wash Acquisition Targets Objectively: The Six-Factor Scorecard
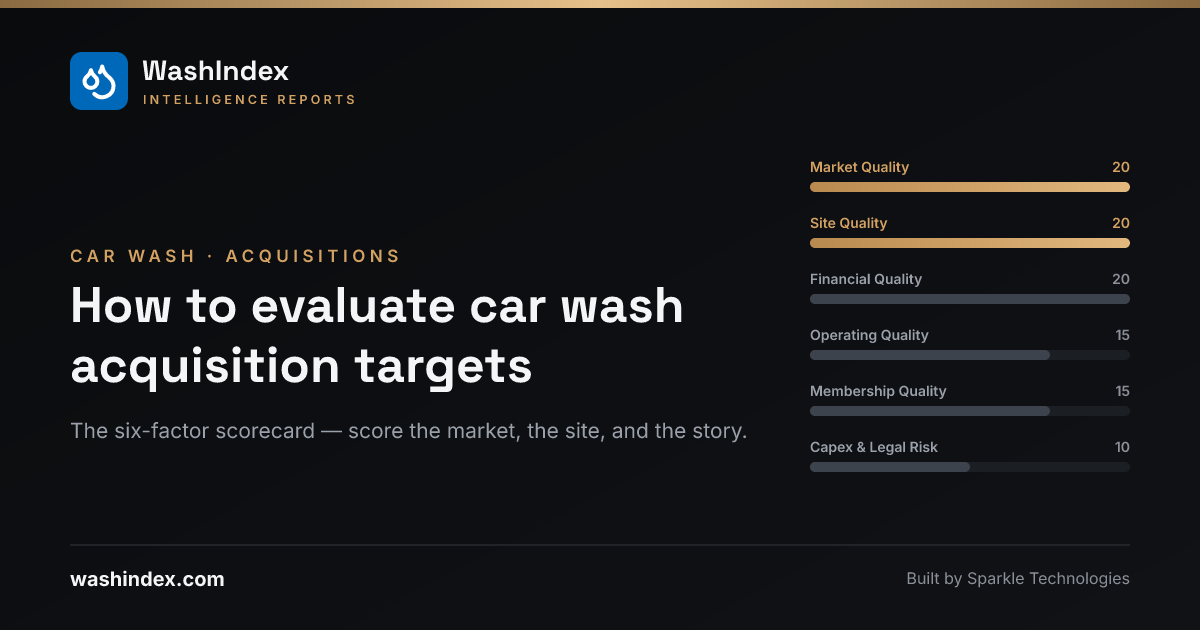
Short answer: Stop underwriting broker narratives — “great site,” “under-managed,” “tons of upside” — and score every target on the same six weighted factors: Market Quality (is this a good trade area?), Site Quality (is this specific parcel advantaged?), financial quality (is the EBITDA real?), operating and customer quality (do customers actually like it?), membership quality (is the recurring revenue durable?), and capex/legal/environmental risk (what blows up after close?). Three of the six — Market Quality, Site Quality, and operating quality — can be measured from independent data before you ever open the seller’s books. That’s exactly what WashIndex was built to do: score the market, the site, and the customer experience for every wash in the US and Canada, so the objective half of your diligence file doesn’t depend on the person selling you the asset.
Car wash deals go wrong in a predictable way: the buyer falls in love with a story and works backward to justify the price. The antidote is boring and effective — a fixed scorecard, applied identically to every target, where the location-driven factors are scored from third-party data rather than the offering memorandum.
The six-factor scorecard
Score each target out of 100, with fixed weights:
| # | Factor | Question it answers | Weight |
|---|---|---|---|
| 1 | Market Quality | Is this a good trade area? | 20 |
| 2 | Site Quality | Is this specific parcel advantaged? | 20 |
| 3 | Financial quality | Are the numbers durable? | 20 |
| 4 | Operating & customer quality | Do customers keep coming back? | 15 |
| 5 | Membership quality | Is the recurring revenue real? | 15 |
| 6 | Capex, legal & environmental risk | What can blow up after close? | 10 |
The first two factors deserve their weight because they’re the ones you can’t fix. Pricing can be changed, staff retrained, memberships restructured, equipment replaced. The trade area and the parcel are what you bought. Cross-sectional analysis of express tunnels consistently shows location-driven factors — traffic, demographics, competitive density, site characteristics — explain the large majority of variance in per-site performance, which is why the site selection chapter of our investment guide calls site selection the single largest driver of return variance in car wash investing.
They’re also the two factors most often scored by vibes. “Great location” should never appear in an investment memo without numbers behind it. Here’s what the numbers are.
Factor 1: Market Quality — score the trade area, not the business
Market Quality asks whether the market would support this wash even if the current operator vanished. The unit of analysis is the trade area — typically a 3- to 5-mile radius or, better, a 10-minute drive-time isochrone built on the real road network — not the metro.
| Metric | What to measure | Benchmark / rule of thumb |
|---|---|---|
| Population & rooftops | Population in the 3- and 5-mile trade area | 30,000–80,000 in 5 miles is a common viable range |
| Household income | Median household income by census tract | ~$60,000+ floor for membership-driven sites; $80,000+ for premium pricing |
| Home values | Proxy for vehicle ownership and willingness to pay | Read relative to the metro, not in absolutes |
| Vehicles per household | Demand signal beyond headcount | Above ~1.8 supports stronger demand |
| Competition density | Existing washes competing for the trade area | Express tunnels per 10,000 households: below ~0.5 expandable; above ~1.0 you’re fighting for existing washers; above ~1.5–2.0 new supply destroys value |
| Competitor quality | Review-derived scores of incumbent washes | A corner “covered” by poorly rated washes is more open than the pin count suggests |
| Market pricing | What nearby washes actually charge, by tier and membership | Sets the realistic ceiling for your menu |
Two things make this factor hard to score honestly by hand:
Saturation is hyper-local. Phoenix, Houston, Dallas–Fort Worth, Charlotte, and parts of Florida all contain trade areas that are badly oversaturated and trade areas that are underserved — sometimes two miles apart. Metro-level judgments (“Texas is overbuilt”) are useless; you need supply counted inside the actual trade area. Our cannibalization research quantifies how density changes a wash’s performance, and it is not a gentle curve.
Competitor quality matters as much as competitor count. Three incumbents with chronic damage complaints and 3.8-star averages are a different market than three well-run 4.6-star operations. This is where structured review data earns its keep: WashIndex scores every one of 80,000+ tracked washes across 7 pillars and 55 signals, so “how good is the competition?” is a number, not a windshield tour.
On the platform, this whole factor is one map view: census-tract choropleths for income, population density, and home values, the full wash supply layer with quality scores, and local pricing — per metro in the market analyses, or per ZIP in the free Site Opportunity calculator.
Factor 2: Site Quality — score the parcel
Two sites with identical trade areas can perform completely differently. Site Quality asks whether this specific parcel converts the market’s traffic into washes.
| Metric | Good sign | Red flag |
|---|---|---|
| Traffic count (AADT) | 25,000–40,000+ on the adjacent road; most top-performing express sites sit above 40,000 | Below ~20,000 without exceptional offsetting factors |
| Road speed | Roughly 25–45 mph — drivers can see the site and turn in | 50+ mph pass-by traffic; the count is worth less |
| Side of street | Going-home side of the commute | Going-to-work side, or divided road forcing a U-turn |
| Visibility | Visible from a half-mile out | Tucked behind retail, poor signage angles |
| Ingress / egress | Easy right-in/right-out from the primary flow | Left across traffic, shared awkward driveways |
| Stacking capacity | Queue depth that survives Saturday peak | Cars spilling into the street — capped throughput that trains customers to leave |
| Vacuum count & layout | Members reliably find a free vacuum | Undersized vacuum field driving member churn |
| Adjacent uses | Grocery, QSR, fuel, daily-needs retail feeding trips | Low-traffic industrial or purely residential pocket |
| Expansion room | Space to add stacking, vacuums, or a second tunnel | Landlocked parcel with no optionality |
The benchmarks here (from the investment guide) matter less than measuring them at the parcel, not the corridor. Two sites on the same road can see meaningfully different exposure depending on intersection geometry, signal placement, and which count station the AADT figure comes from — which is why WashIndex carries traffic counts at the site level, generates real 5-, 10-, and 15-minute drive-time trade areas from any point (not radius rings), and layers satellite imagery with points of interest so visibility, ingress/egress, stacking room, and adjacent draws can be assessed without a site visit for every candidate.
One asymmetry worth internalizing: a mediocre operator on a great site is a fixable deal; a great operator on a bad site is structurally capped. When Site Quality is high and operating quality is low, you may be looking at the best kind of target. The reverse pattern is how buyers overpay for someone else’s hard work.
Factor 3: Financial quality — rebuild the EBITDA
This factor comes from seller diligence, not third-party data, so the discipline is reconstruction rather than measurement. Don’t accept trailing-twelve-month EBITDA; rebuild it into three numbers:
- Seller EBITDA — what the offering memorandum claims.
- Normalized EBITDA — after scrubbing add-backs, inserting market-rate rent and a real manager salary, and restating maintenance, insurance, and marketing at sustainable levels.
- Maintenance-capex-adjusted EBITDA — normalized EBITDA minus the annualized cost of keeping the equipment competitive. This is the number you underwrite.
Along the way, reconcile POS reports to bank deposits, pull revenue by month to see seasonality and trend, check retail-versus-membership mix, and treat utilities-per-car and repair spend as operational tripwires — an anomalously low repair line usually means the capex is waiting for you on the other side of closing.
To be explicit about the division of labor: WashIndex does not model site-level revenue, EBITDA, or member counts — deliberately. It’s an independent market- and operating-quality layer that either corroborates or contradicts the financial story. When the seller says “this market supports a price increase” or “volume is limited by competition,” the objective layers are how you check.
Factor 4: Operating & customer quality — the independent check
Star ratings collapse too much signal. A 4.6-star wash with chronic wait-time complaints is a different asset than a 4.6-star wash with clean reviews and one equipment outlier. Structured review analysis reads them differently; averages don’t.
What to score, for the target and every competitor in the trade area:
- Trajectory, not snapshot — is measured quality improving or declining over the last 24 months?
- Damage-mention rate — the highest-stakes red flag; elevated damage complaints are both a liability signal and a churn driver.
- Wait time and throughput complaints — often a stacking or staffing problem you can price, sometimes a structural site defect you can’t.
- Staff sentiment — one of the few durable local advantages.
- Membership friction — billing complaints and cancellation-difficulty language predict churn and regulatory risk.
- Position versus the local benchmark — the same 4.4 rating means different things next to 4.7 competitors versus 3.9 competitors.
This is WashIndex’s home turf: 14M+ reviews processed into 7 pillars and 55 structured signals per location, validated per the methodology, with competitive benchmarking against every nearby wash. For buyers running a thesis across many targets, the private equity intelligence page shows how the same signals roll up to sourcing screens — premium roll-up, fixer-upper, distressed — instead of one-off checks.
Factor 5: Membership quality — is the recurring revenue durable?
Membership revenue deserves a premium only when it’s durable. Score membership quality separately from membership size: a site with 2,000 long-tenured members and low churn is worth more than a site with 4,000 members acquired through aggressive discounting and holding on through cancellation friction.
From the seller, demand monthly cohort data: active members by month, joins, cancels, net adds, revenue per member, failed payments, and tenure cohorts. If the seller can’t produce member cohorts, that is itself diligence signal — price it.
From independent data, check the outside view: membership-value sentiment in reviews, billing-complaint frequency, and cancellation-friction language. Our acquisition quality study — 4,178 sites with confirmed ownership changes — found membership value is the dimension that deteriorates most durably after consolidator acquisitions, with cancellation friction rising post-close. If your value-creation plan is “raise membership prices and tighten cancellation,” the data says customers notice, and it doesn’t recover in year two.
Factor 6: Capex, legal & environmental risk — what blows up after close
The residual 10 points cover the diligence checklist that turns good deals bad: tunnel and conveyor condition, deferred maintenance (“EBITDA created by not fixing things”), water and sewer rates and reclaim compliance, environmental exposure around drainage and chemical handling, lease term and escalators (or the real estate itself), zoning and expansion rights, claims history, gift-card and prepaid liabilities, and manager dependency. The due diligence chapter walks the full list.
Review data contributes tripwires here too: recurring equipment-downtime mentions and damage reports are the customer-visible shadow of an under-maintained plant, and they’re visible before you pay for the equipment inspection.
Putting it together: score, then decide
The whole framework below is implemented as a free interactive tool — the Car Wash Underwriting Tool scores all six factors, runs the EBITDA bridge, and produces the valuation and IC summary live.
| Total score | Decision posture |
|---|---|
| 85–100 | Priority target — pursue, and be willing to pay for quality |
| 70–84 | Good target — proceed with price discipline |
| 55–69 | Only at a discount, with a specific value-creation plan |
| Below 55 | Pass, absent a unique strategic reason |
A one-page output per target keeps the process honest:
| Factor | Score | Key evidence |
|---|---|---|
| Market Quality | 16 / 20 | $84K median income, 1.9 vehicles/HH; 0.8 tunnels per 10K households; incumbents average 4.1 |
| Site Quality | 14 / 20 | 38K AADT, going-home side, good visibility; stacking marginal at peak |
| Financial quality | 12 / 20 | Add-backs aggressive; repairs restated up; capex-adjusted EBITDA 18% below claimed |
| Operating quality | 13 / 15 | Above local benchmark on quality and staff; damage mentions low; trend flat |
| Membership quality | 9 / 15 | Solid member count; no cohort data provided; billing complaints slightly elevated |
| Risk | 6 / 10 | Equipment mid-life; sewer rate increase pending |
| Total | 70 / 100 | Buy only at a disciplined multiple |
Then force three sentences: the thesis (“good site in a strong market with fixable operations”), the main risk (“membership durability unverified; capex likely understated”), and the price implication (“no premium multiple without member cohorts and a clean equipment inspection”).
The rule that makes the scorecard worth building: don’t let price override the score. A cheap wash that scores 48 is not a bargain — it’s a bad wash with a smaller check attached. And the single most common failure mode is underwriting headline EBITDA on a weak-market, weak-site asset, because current cash flow is the one number that can look great right up until the new express tunnel opens across the street.
Where the objective data comes from
A disciplined diligence file has three layers, and only one of them comes from the seller:
- Financial truth — POS, bank statements, tax returns, payroll, member cohorts. Seller-provided; your job is reconstruction.
- Market and site truth — demographics, traffic, drive-time trade areas, competition density, competitor pricing. Independent and measurable: this is Market Quality and Site Quality, and it’s scoreable for any address in the country before the first management meeting.
- Customer truth — structured review signal on quality, damage, waits, staff, and membership friction, benchmarked against the local competitive set. Also independent, and very hard for a seller to dress up.
The best acquisitions are the ones where all three layers agree. When they disagree — strong claimed financials on a weak market and a declining customer experience — the scorecard catches what the story hides.
Start with the free Site Opportunity by ZIP calculator to score a target’s Market Quality in thirty seconds, browse the metro market analyses for trade-area context, then launch the platform to run the full Market Quality × Site Quality × operating quality screen on every target in your pipeline.
This framework is now a full working kit: the interactive underwriting tool scores all six factors live with a score-guided valuation, the underwriting guide walks the complete exam including the worked EBITDA bridge and the DSCR math, the due-diligence checklist enumerates all 44 verification items, and the valuation multiples reference covers what washes actually trade at.