The WashIndex Car Wash Market Saturation Index: The Most Oversaturated and Underserved U.S. Markets (Q2 2026)
A demand-adjusted quarterly index scoring every large U.S. metro from most underserved (0) to most oversaturated (100) — built from 24,812 professional wash locations joined to U.S. Census demand fundamentals.
- 24,812 washes indexed
- 193 large metros ranked
- 42.9% over capacity
- 415 washes gone dark
- Q2 2026 · methodology v2.0
Chicago is the most oversaturated car wash market in the United States. Its wash supply runs 48% above what its climate, commuting patterns, incomes, and vehicle base support; 53% of its washes sit in trade areas already beyond modeled organic demand; and the median advertised unlimited membership has been discounted to $19.95. Nationally, 42.9% of America’s washes now operate beyond their trade area’s modeled capacity, one in five washes is less than two years old — and the shakeout has begun: 415 washes have gone dark in the trailing year.
WashIndex Market Saturation Index (MSI) · Q2 2026 edition · methodology v2.0 · published 2026-07-01 · data through 2026-06-30 · 24,812 professional wash locations (contiguous U.S.) · 193 large metros ranked
The index in 60 seconds
The WashIndex Market Saturation Index (MSI) scores every large U.S. metropolitan area (250,000+ residents) from 0 (most underserved) to 100 (most oversaturated). It is published quarterly, built from the WashIndex location-level index of 24,812 operating professional car washes joined to U.S. Census population, vehicle, commuting, and income data — and, unlike a per-capita listicle, it is demand-adjusted: a snow-belt metro is expected to carry more washes than a transit-heavy coastal one, and the index scores each market against its own fundamentals.
The MSI averages four equally weighted signals (each standardized across the 193 ranked metros):
- Demand-adjusted supply density — actual washes per 100k residents vs. the level predicted by winter climate, precipitation, drive-alone commute share, household income, and vehicles per capita (model R² = 0.32).
- Capacity strain — the share of a metro’s washes located in trade areas where observed demand already exceeds the WashIndex opportunity model’s sustainable capacity. Demand is measured on Google Local Guide reviews only — organic, high-volume reviewers whose behavior is resistant to the review-solicitation campaigns chains run.
- Demand utilization, inverted — the median wash’s Local Guide review velocity. Quiet washes in a crowded metro signal oversupply; busy washes signal unmet demand. (Local Guide basis, same reason as above.)
- Price pressure — the metro’s median advertised unlimited-membership entry price (5,074 washes with scraped pricing). Discounting is what oversaturation does.
Scores are shrunk toward the mean in proportion to sample size, so a 40-wash metro cannot whipsaw the rankings, and each metro carries a confidence tier. Alongside the MSI level index, two momentum indicators — the supply-vs-demand growth gap and the going-dark rate — track where saturation is heading. Rankings are robust: under ±40% perturbations of every component weight, rank correlation stays ≥ 0.88. Full methodology in the appendix.
1. The national picture
The contiguous U.S. has 24,812 operating professional car washes — one for every 13,619 residents (7.3 per 100,000) — and 43% of them are in trade areas already beyond modeled organic demand.
Key national facts this quarter:
| Measure | Q2 2026 value |
|---|---|
| Professional washes indexed (contiguous U.S. + DC) | 24,812 |
| Express tunnels | 8,883 (35.8% of supply) |
| Self-serve bay sites / in-bay automatics / full-service | 8,442 / 4,253 / 3,234 |
| Washes per 100,000 residents (national) | 7.34 |
| Washes in over-capacity trade areas | 42.9% |
| Share of washes opened in the last 24 months | 19.0% |
| Washes gone dark (silent 12+ months against their own review cadence) | 415 (1.7%) |
| Median advertised unlimited entry price | $22.99 |
| Washes advertising $10-or-less entry offers | 4.6% |
The supply wave has met its first wall. One in five operating washes is less than two years old, yet 42.9% of all washes now sit in trade areas absorbing more volume than the WashIndex capacity model says they sustain — and 415 washes with established review histories have fallen silent for a year or more. The industry built ahead of demand; in the most crowded markets, the correction is now visible in the data.
External anchor: the Census Bureau’s County Business Patterns counted 19,463 employer car wash establishments (NAICS 811192) in 2022 — a subset of the WashIndex universe, which also captures unstaffed self-serve and in-bay locations. State-level counts correlate at r = 0.949.
2. The 25 most oversaturated car wash markets, 2026
Chicago (MSI 100), St. Louis (99.5), and Detroit (99.0) top the index. Six of the top ten are Midwestern — and the coastal surprise is San Jose (#5), which qualifies not on density but on strain: 63% of its washes sit in trade areas already beyond organic-demand capacity, with quiet washes and a $20 entry price. Houston (#21) and San Antonio (#25) carry the Sun Belt flag, both with supply 36–45% above fundamentals.
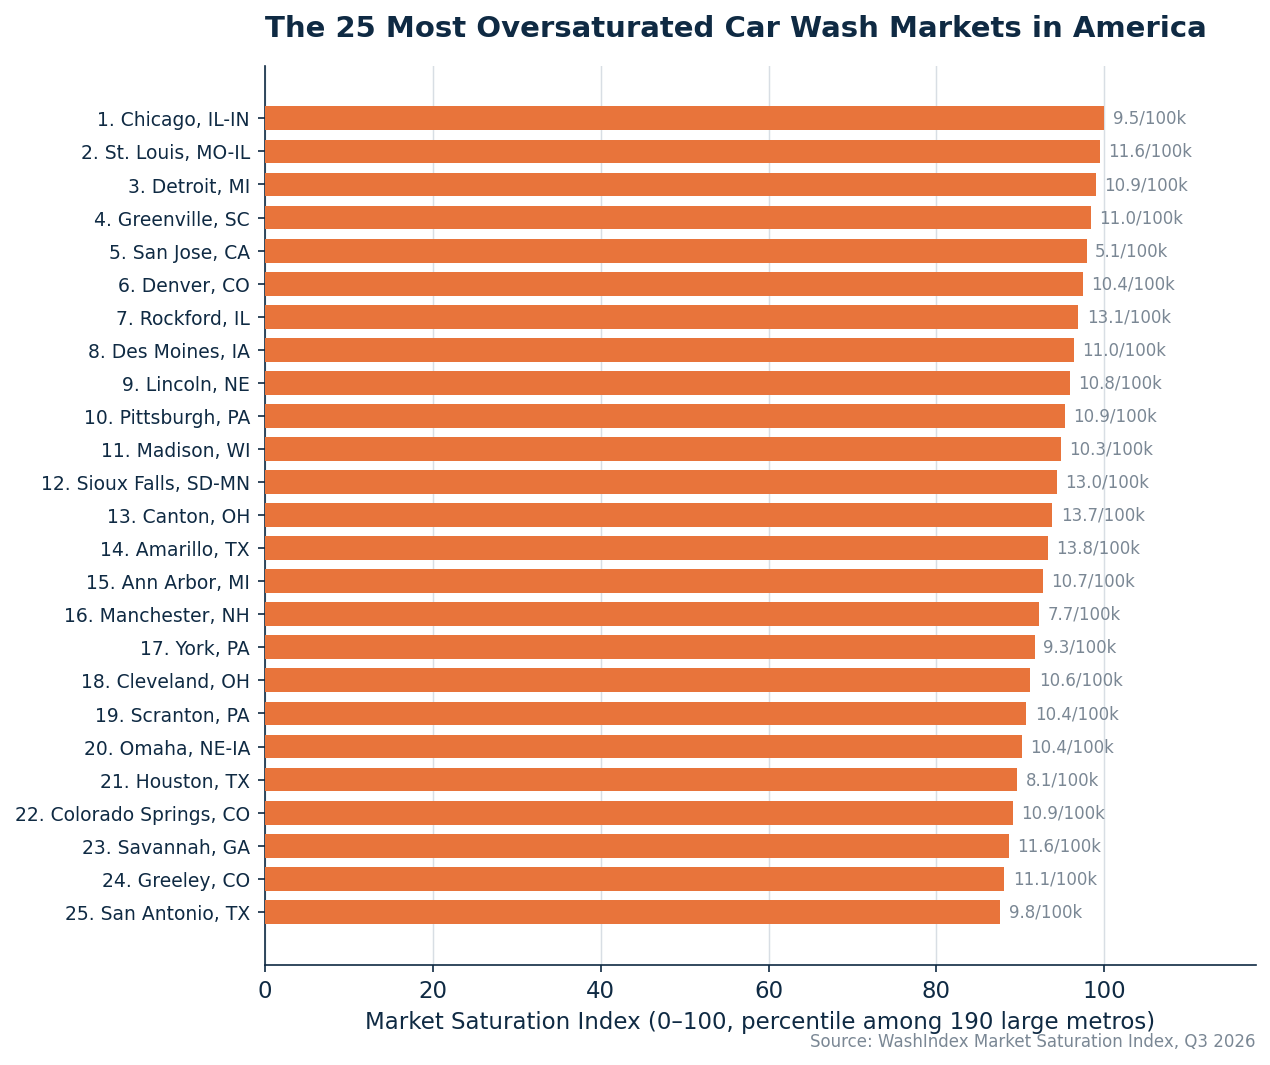
| # | Metro | MSI | Washes | Per 100k | vs. expected | Over-capacity | Entry price | New (24 mo) | Gone dark | Conf. |
|---|---|---|---|---|---|---|---|---|---|---|
| 1 | Chicago-Naperville-Elgin, IL-IN | 100.0 | 892 | 9.5 | +48% | 53% | $20 | 20% | 1.2% | High |
| 2 | St. Louis, MO-IL | 99.5 | 325 | 11.6 | +43% | 48% | $22 | 15% | 2.5% | High |
| 3 | Detroit-Warren-Dearborn, MI | 99.0 | 481 | 10.9 | +31% | 58% | $22 | 22% | 1.0% | High |
| 4 | Greenville-Anderson-Greer, SC | 98.4 | 110 | 11.0 | +39% | 59% | — | 16% | 0.9% | High |
| 5 | San Jose-Sunnyvale-Santa Clara, CA | 97.9 | 101 | 5.1 | -9% | 63% | $20 | 14% | 1.0% | High |
| 6 | Denver-Aurora-Centennial, CO | 97.4 | 317 | 10.4 | +31% | 55% | — | 13% | 0.6% | High |
| 7 | Rockford, IL | 96.9 | 44 | 13.1 | +40% | 57% | $23 | 27% | 0.0% | Medium |
| 8 | Des Moines-West Des Moines, IA | 96.4 | 83 | 11.0 | +30% | 58% | — | 18% | 3.6% | Medium |
| 9 | Lincoln, NE | 95.9 | 38 | 10.8 | +16% | 63% | — | 13% | 5.3% | Low |
| 10 | Pittsburgh, PA | 95.3 | 264 | 10.9 | +40% | 41% | $20 | 13% | 2.3% | High |
| 11 | Madison, WI | 94.8 | 73 | 10.3 | +33% | 52% | $24 | 19% | 0.0% | Medium |
| 12 | Sioux Falls, SD-MN | 94.3 | 40 | 13.0 | +27% | 50% | — | 30% | 5.0% | Medium |
| 13 | Canton-Massillon, OH | 93.8 | 55 | 13.7 | +43% | 42% | $20 | 18% | 1.8% | Medium |
| 14 | Amarillo, TX | 93.3 | 38 | 13.8 | +50% | 53% | $25 | 18% | 7.9% | Low |
| 15 | Ann Arbor, MI | 92.7 | 40 | 10.7 | +57% | 15% | $9 | 22% | 5.0% | Medium |
| 16 | Manchester-Nashua, NH | 92.2 | 33 | 7.7 | -1% | 67% | $22 | 21% | 0.0% | Low |
| 17 | York-Hanover, PA | 91.7 | 44 | 9.3 | +9% | 54% | $20 | 7% | 4.5% | Medium |
| 18 | Cleveland, OH | 91.2 | 231 | 10.6 | +28% | 47% | $22 | 13% | 0.9% | High |
| 19 | Scranton--Wilkes-Barre, PA | 90.7 | 60 | 10.4 | +26% | 55% | $25 | 12% | 0.0% | Medium |
| 20 | Omaha, NE-IA | 90.2 | 104 | 10.4 | +19% | 55% | — | 21% | 1.9% | High |
| 21 | Houston-Pasadena-The Woodlands, TX | 89.6 | 632 | 8.1 | +36% | 56% | $23 | 24% | 1.9% | High |
| 22 | Colorado Springs, CO | 89.1 | 85 | 10.9 | +22% | 60% | — | 31% | 1.2% | Medium |
| 23 | Savannah, GA | 88.6 | 50 | 11.6 | +71% | 37% | — | 28% | 0.0% | Medium |
| 24 | Greeley, CO | 88.1 | 41 | 11.1 | +25% | 40% | — | 17% | 0.0% | Medium |
| 25 | San Antonio-New Braunfels, TX | 87.6 | 270 | 9.8 | +45% | 48% | $22 | 25% | 1.5% | High |
Three reads on this table:
- Chicago (MSI 100) is oversupplied on every signal at once: density 48% above its demand fundamentals, 53% of washes in over-capacity trade areas, a median of just 8 organic reviews per wash per year, and a $19.95 median entry price — the discounting is already here.
- Ann Arbor (#15) is the price-war poster child. Supply 57% above fundamentals, a $9 median entry offer, and 5% of its washes already gone dark. Where those three numbers coexist, margin has left the market.
- Amarillo (#14) is where the cycle completes. America’s densest wash market (7,228 residents per wash, 50% above fundamentals) also posts the nation’s highest going-dark rate: 7.9% of its washes have fallen silent. Density is the warning; the shakeout is the event — and in Amarillo both are on the board at once.
3. The 25 most underserved car wash markets, 2026
Bridgeport-Stamford-Danbury, CT is the most underserved car wash market in America. Its supply runs 15% below its demand fundamentals, barely a quarter of its washes sit in strained trade areas, its washes stay busier than the large-metro norm — and the median unlimited membership holds at $32, among the highest prices in the index. Premium pricing with no supply response is what real whitespace looks like.
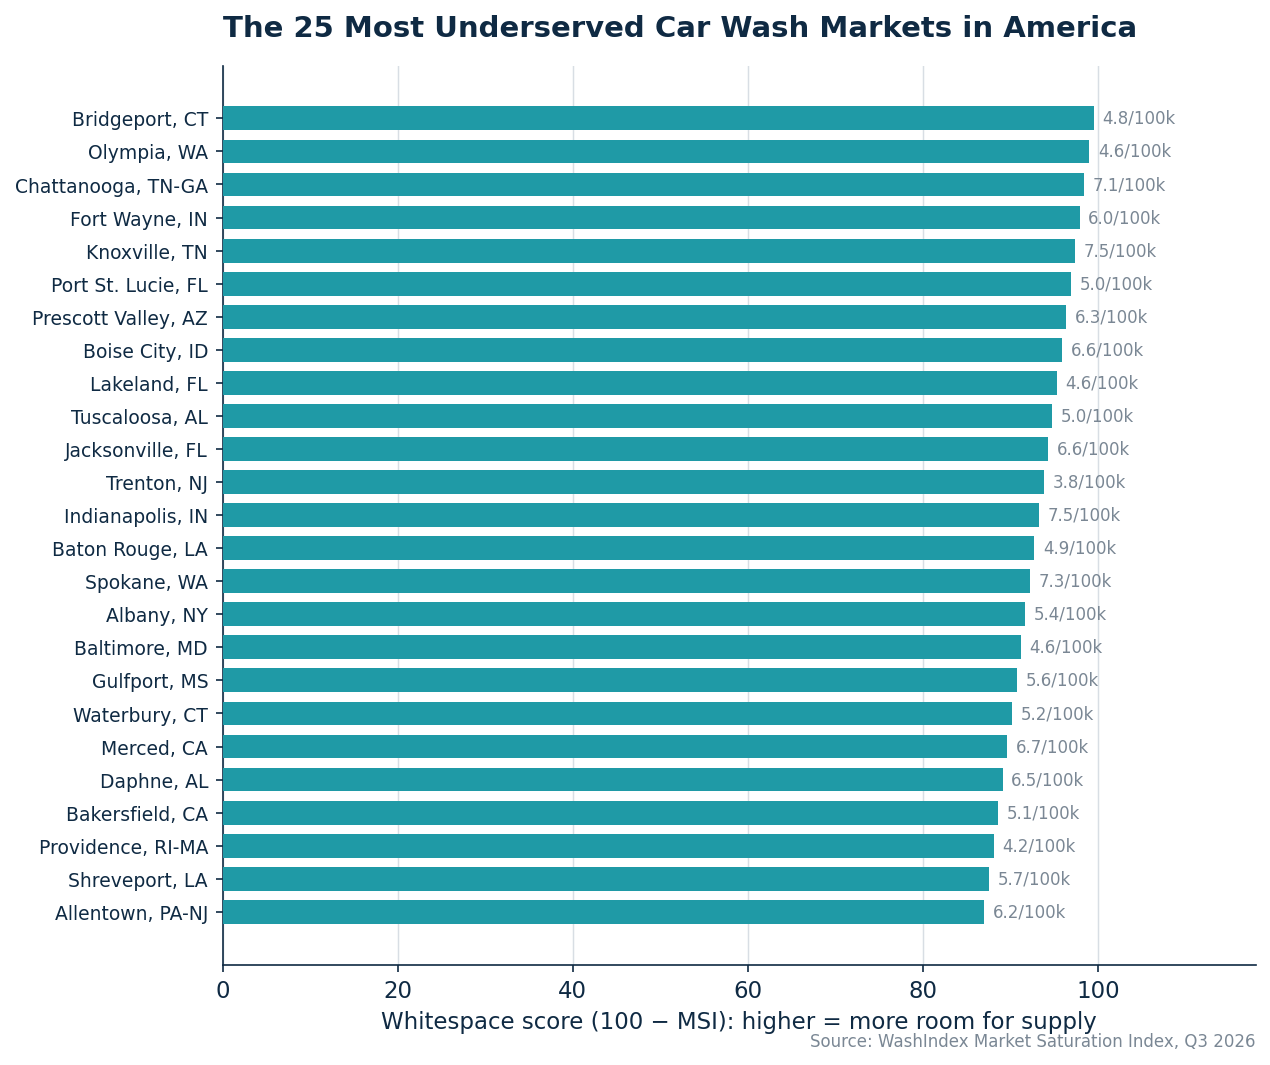
| # | Metro | MSI | Washes | Per 100k | vs. expected | Over-capacity | Entry price | New (24 mo) | Gone dark | Conf. |
|---|---|---|---|---|---|---|---|---|---|---|
| 193 | Bridgeport-Stamford-Danbury, CT | 0.5 | 47 | 4.8 | -15% | 28% | $32 | 13% | 2.1% | Medium |
| 192 | Olympia-Lacey-Tumwater, WA | 1.0 | 14 | 4.6 | -35% | 21% | $30 | 7% | 0.0% | Low |
| 191 | Chattanooga, TN-GA | 1.6 | 42 | 7.1 | -8% | 21% | — | 7% | 0.0% | Medium |
| 190 | Fort Wayne, IN | 2.1 | 28 | 6.0 | -34% | 50% | $34 | 14% | 0.0% | Low |
| 189 | Knoxville, TN | 2.6 | 72 | 7.5 | -12% | 42% | — | 24% | 0.0% | Medium |
| 188 | Port St. Lucie, FL | 3.1 | 28 | 5.0 | -17% | 29% | $24 | 21% | 0.0% | Low |
| 187 | Prescott Valley-Prescott, AZ | 3.6 | 16 | 6.3 | -38% | 6% | $20 | 6% | 0.0% | Low |
| 186 | Boise City, ID | 4.1 | 56 | 6.6 | -27% | 47% | — | 12% | 1.8% | Medium |
| 185 | Lakeland-Winter Haven, FL | 4.7 | 39 | 4.6 | -25% | 26% | $22 | 20% | 0.0% | Low |
| 184 | Tuscaloosa, AL | 5.2 | 14 | 5.0 | -36% | 29% | — | 21% | 0.0% | Low |
| 183 | Jacksonville, FL | 5.7 | 116 | 6.6 | +9% | 51% | $33 | 20% | 0.9% | High |
| 182 | Trenton-Princeton, NJ | 6.2 | 15 | 3.8 | -30% | 20% | — | 0% | 0.0% | Low |
| 181 | Indianapolis-Carmel-Greenwood, IN | 6.7 | 162 | 7.5 | -4% | 46% | $28 | 17% | 1.2% | High |
| 180 | Baton Rouge, LA | 7.3 | 43 | 4.9 | -27% | 33% | — | 7% | 2.3% | Medium |
| 179 | Spokane-Spokane Valley, WA | 7.8 | 44 | 7.3 | -21% | 43% | $23 | 16% | 0.0% | Medium |
| 178 | Albany-Schenectady-Troy, NY | 8.3 | 49 | 5.4 | -28% | 43% | $28 | 8% | 0.0% | Medium |
| 177 | Baltimore-Columbia-Towson, MD | 8.8 | 131 | 4.6 | -29% | 33% | — | 21% | 1.5% | High |
| 176 | Gulfport-Biloxi, MS | 9.3 | 24 | 5.6 | -26% | 26% | — | 17% | 0.0% | Low |
| 175 | Waterbury-Shelton, CT | 9.8 | 24 | 5.2 | -29% | 42% | $24 | 8% | 0.0% | Low |
| 174 | Merced, CA | 10.4 | 20 | 6.7 | -13% | 10% | $23 | 10% | 0.0% | Low |
| 173 | Daphne-Fairhope-Foley, AL | 10.9 | 17 | 6.5 | -6% | 19% | — | 6% | 0.0% | Low |
| 172 | Bakersfield-Delano, CA | 11.4 | 47 | 5.1 | -38% | 45% | $23 | 17% | 0.0% | Medium |
| 171 | Providence-Warwick, RI-MA | 11.9 | 72 | 4.2 | -42% | 42% | $23 | 24% | 1.4% | Medium |
| 170 | Shreveport-Bossier City, LA | 12.4 | 22 | 5.7 | -28% | 27% | — | 14% | 4.5% | Low |
| 169 | Allentown-Bethlehem-Easton, PA-NJ | 13.0 | 55 | 6.2 | -20% | 46% | $24 | 13% | 1.8% | Medium |
Where did Washington and New York go? In a naive per-capita ranking, the transit metros own the “underserved” list. The demand adjustment changes that verdict: given how few of its residents commute by car, New York’s supply is actually 11% above its fundamentals (MSI 65 — the seventh most saturated megametro), and Washington, DC lands mid-pack (MSI 33) rather than last. The whitespace that survives demand adjustment — Bridgeport, Chattanooga, Knoxville, Tuscaloosa — is where washes are demonstrably busy on organic demand and supply is demonstrably thin. (Alaska and Hawaii sit outside the index scope this edition; see coverage notes.)
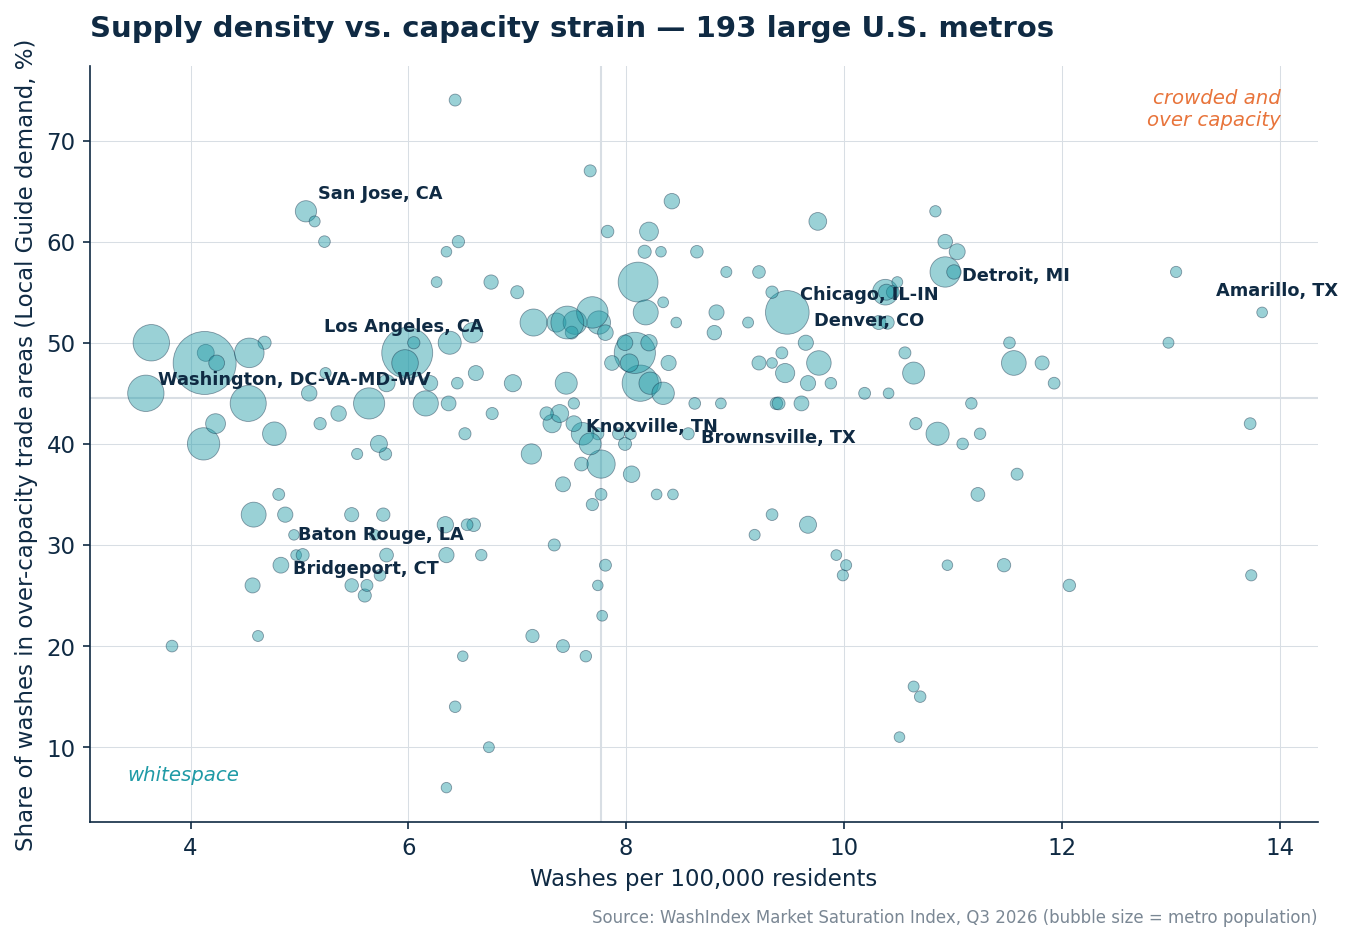
Exhibit 3 — The whole index on one chart: density (x) vs. share of washes in over-capacity trade areas (y). The upper-right is crowded and over capacity; the lower-left is whitespace.
4. America’s largest metros, ranked
The fifteen metros above four million residents split into three tiers:
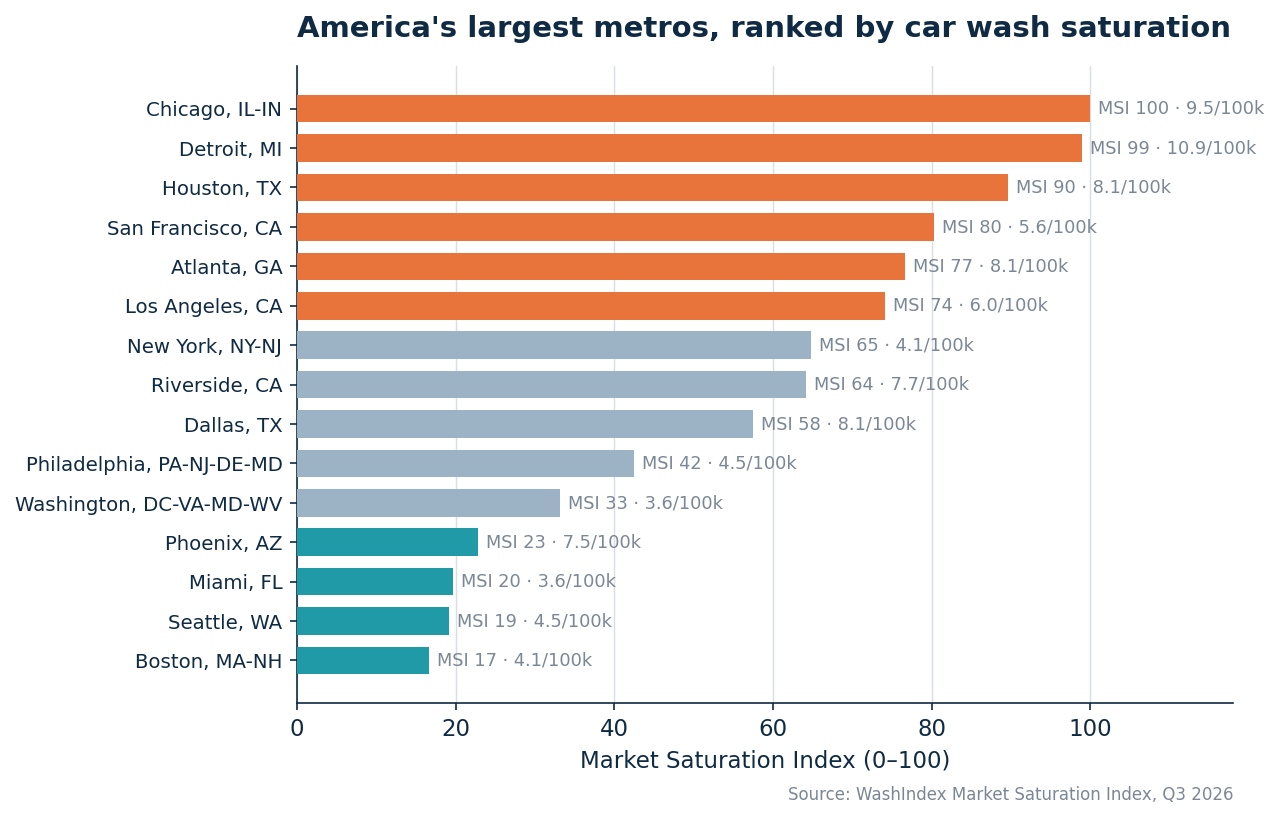
- Saturated (MSI 90–100): Chicago, Detroit, and Houston — 31–48% more supply than their fundamentals, with over half their washes in strained trade areas.
- Elevated (MSI 58–80): San Francisco, Atlanta, Los Angeles, New York, Riverside, and Dallas. LA and New York qualify on capacity strain and quiet washes despite modest per-capita density — the demand adjustment strips away their “underserved” reputation.
- Underserved (MSI 17–43): Philadelphia, Washington, Phoenix, Miami, Seattle, and Boston. Washington, Miami, and Boston are the cleanest large-market greenfield theses: supply 23–32% below fundamentals with busy washes. Phoenix is the capacity-adjusted surprise — near-expected density, but its washes stay unusually busy on organic demand, so the index reads room to build.
5. Momentum: where saturation is heading
The MSI is a level index. These two indicators are its derivative — where supply is still flooding in, and where the shakeout has already started.
5.1 Building into the shakeout
McAllen and Beaumont, TX are adding supply at an 18-point annualized gap over their population growth — and in 23 large metros, a quarter or more of all operating washes are less than two years old.
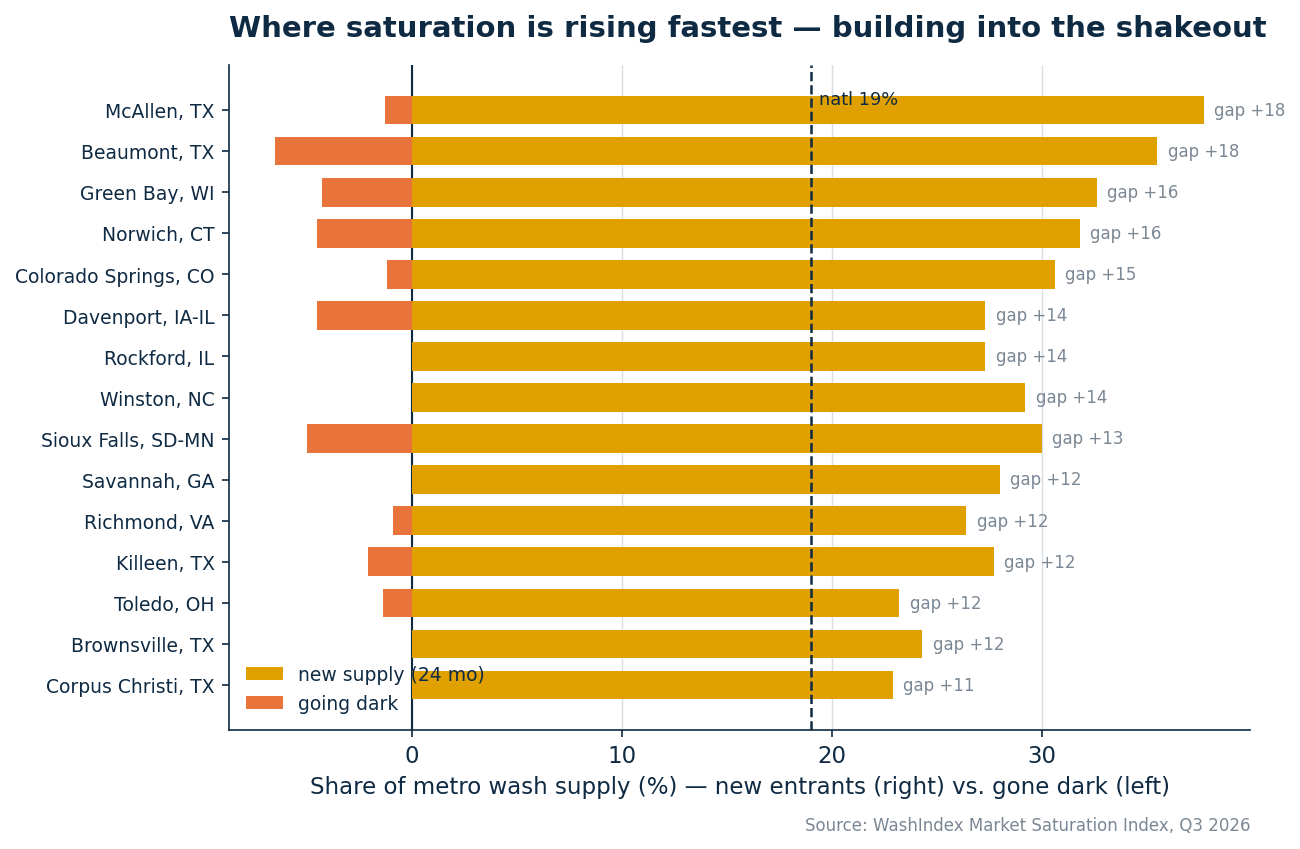
Exhibit 5 — The 15 at-or-above-median-density metros with the largest supply-vs-demand growth gap. Gold: share of supply added in 24 months. Orange (left): share gone dark.
| # | Metro | MSI | New (24 mo) | Gone dark | Pop. growth (yr) | Supply-demand gap (yr) |
|---|---|---|---|---|---|---|
| 31 | McAllen-Edinburg-Mission, TX | 84.5 | 37.7% | 1.3% | 1.2% | +17.7% |
| 168 | Beaumont-Port Arthur, TX | 13.5 | 35.5% | 6.5% | 0.1% | +17.7% |
| 63 | Green Bay, WI | 67.9 | 32.6% | 4.3% | 0.5% | +15.8% |
| 62 | Norwich-New London-Willimantic, CT | 68.4 | 31.8% | 4.5% | 0.4% | +15.5% |
| 22 | Colorado Springs, CO | 89.1 | 30.6% | 1.2% | 0.6% | +14.7% |
| 33 | Davenport-Moline-Rock Island, IA-IL | 83.4 | 27.3% | 4.5% | -0.1% | +13.8% |
| 7 | Rockford, IL | 96.9 | 27.3% | 0.0% | -0.1% | +13.7% |
| 66 | Winston-Salem, NC | 66.3 | 29.2% | 0.0% | 1.1% | +13.6% |
| 12 | Sioux Falls, SD-MN | 94.3 | 30.0% | 5.0% | 1.8% | +13.2% |
| 23 | Savannah, GA | 88.6 | 28.0% | 0.0% | 1.6% | +12.4% |
| 121 | Richmond, VA | 37.8 | 26.4% | 0.9% | 1.0% | +12.2% |
| 87 | Killeen-Temple, TX | 55.4 | 27.7% | 2.1% | 1.6% | +12.2% |
| 78 | Toledo, OH | 60.1 | 23.2% | 1.4% | -0.2% | +11.8% |
| 152 | Brownsville-Harlingen, TX | 21.8 | 24.3% | 0.0% | 0.6% | +11.6% |
| 116 | Corpus Christi, TX | 40.4 | 22.9% | 0.0% | 0.2% | +11.2% |
5.2 Shakeout watch
The going-dark list is the index’s most important early-warning table. These are the large metros where the highest share of established washes has stopped earning reviews for a year or more — supply exiting in real time.
| # | Metro | MSI | Gone dark | New (24 mo) | Per 100k | vs. expected |
|---|---|---|---|---|---|---|
| 14 | Amarillo, TX | 93.3 | 7.9% | 18.4% | 13.8 | +50% |
| 168 | Beaumont-Port Arthur, TX | 13.5 | 6.5% | 35.5% | 7.8 | +3% |
| 111 | Wichita, KS | 43.0 | 5.6% | 11.1% | 8.2 | -16% |
| 9 | Lincoln, NE | 95.9 | 5.3% | 13.2% | 10.8 | +16% |
| 12 | Sioux Falls, SD-MN | 94.3 | 5.0% | 30.0% | 13.0 | +27% |
| 15 | Ann Arbor, MI | 92.7 | 5.0% | 22.5% | 10.7 | +57% |
| 136 | Lubbock, TX | 30.1 | 4.9% | 24.4% | 11.2 | +21% |
| 113 | Springfield, MO | 42.0 | 4.7% | 11.6% | 8.7 | -1% |
| 17 | York-Hanover, PA | 91.7 | 4.5% | 6.8% | 9.3 | +9% |
| 33 | Davenport-Moline-Rock Island, IA-IL | 83.4 | 4.5% | 27.3% | 11.5 | +19% |
| 48 | Lansing-East Lansing, MI | 75.6 | 4.4% | 22.2% | 9.4 | +13% |
| 63 | Green Bay, WI | 67.9 | 4.3% | 32.6% | 13.7 | +36% |
| 65 | Buffalo-Cheektowaga, NY | 66.8 | 4.2% | 12.5% | 4.1 | -49% |
| 8 | Des Moines-West Des Moines, IA | 96.4 | 3.6% | 18.1% | 11.0 | +30% |
| 75 | Little Rock-North Little Rock-Conway, AR | 61.7 | 3.6% | 12.5% | 7.3 | -10% |
Amarillo is the cautionary tale. America’s densest wash market (13.8 per 100k, 50% above fundamentals) now posts the nation’s highest going-dark rate at 7.9% — while still adding new supply at 18% per two years. Lincoln (#9 on the index, 5.3% dark) and Sioux Falls (#12, 5.0%) pair top-of-index saturation scores with active exits. And Wichita debuts directly on the shakeout list: 5.6% of its washes are already dark on its first quarter in the index. Nationally, 110 of the 193 ranked metros have at least one established wash gone dark this year.
6. The express-tunnel sub-index
Express tunnels — the format private equity built — are now 35.8% of U.S. professional wash supply (8,883 tunnels). The Express Saturation Sub-Index (XSI) re-runs the index construction on express-only signals — tunnel density, express trade-area strain, express membership pricing, and express new-supply share — for the metros with ten or more tunnels.
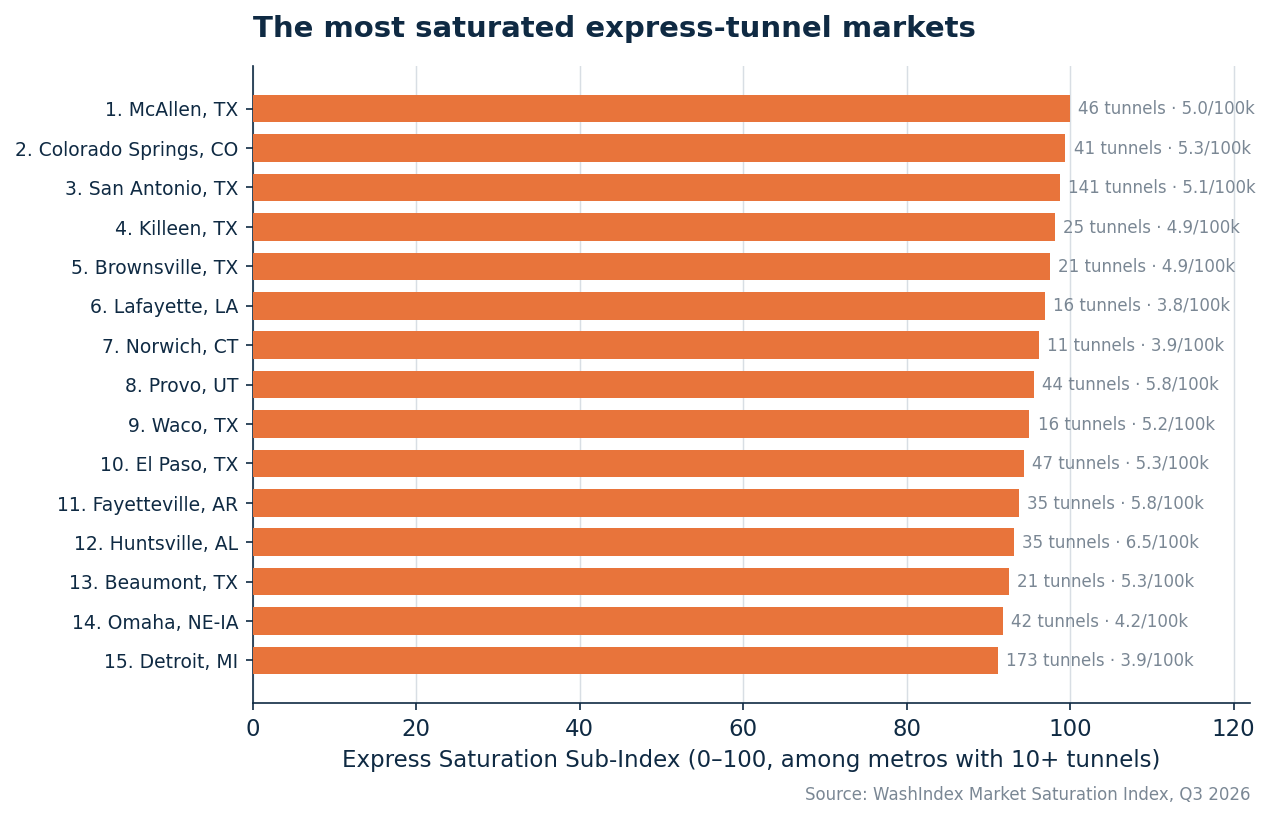
| XSI rank | Metro | XSI | Tunnels | Tunnels per 100k | MSI (all formats) | Metro new supply (24 mo) |
|---|---|---|---|---|---|---|
| 1 | McAllen-Edinburg-Mission, TX | 100.0 | 46 | 5.0 | 84.5 | 37.7% |
| 2 | Colorado Springs, CO | 99.4 | 41 | 5.3 | 89.1 | 30.6% |
| 3 | San Antonio-New Braunfels, TX | 98.7 | 141 | 5.1 | 87.6 | 25.2% |
| 4 | Killeen-Temple, TX | 98.1 | 25 | 4.9 | 55.4 | 27.7% |
| 5 | Brownsville-Harlingen, TX | 97.5 | 21 | 4.9 | 21.8 | 24.3% |
| 6 | Lafayette, LA | 96.9 | 16 | 3.8 | 82.4 | 37.0% |
| 7 | Norwich-New London-Willimantic, CT | 96.2 | 11 | 3.9 | 68.4 | 31.8% |
| 8 | Provo-Orem-Lehi, UT | 95.6 | 44 | 5.8 | 25.4 | 17.9% |
| 9 | Waco, TX | 95.0 | 16 | 5.2 | 56.5 | 21.4% |
| 10 | El Paso, TX | 94.3 | 47 | 5.3 | 52.3 | 21.2% |
| 11 | Fayetteville-Springdale-Rogers, AR | 93.7 | 35 | 5.8 | 52.8 | 20.3% |
| 12 | Huntsville, AL | 93.1 | 35 | 6.5 | 68.9 | 15.7% |
| 13 | Beaumont-Port Arthur, TX | 92.5 | 21 | 5.3 | 13.5 | 35.5% |
| 14 | Omaha, NE-IA | 91.8 | 42 | 4.2 | 90.2 | 21.2% |
| 15 | Detroit-Warren-Dearborn, MI | 91.2 | 173 | 3.9 | 99.0 | 22.5% |
Texas owns the express map — seven of the fifteen XSI hotspots, led by McAllen (#1), San Antonio (#3), Killeen (#4), and Brownsville (#5), where tunnel supply and twenty-plus percent two-year new-supply rates collide. McAllen is the purest tunnel war in America: #1 on express saturation while ranking #31 overall — the battle there is format-specific, fought over the same membership dollars.
7. State rankings
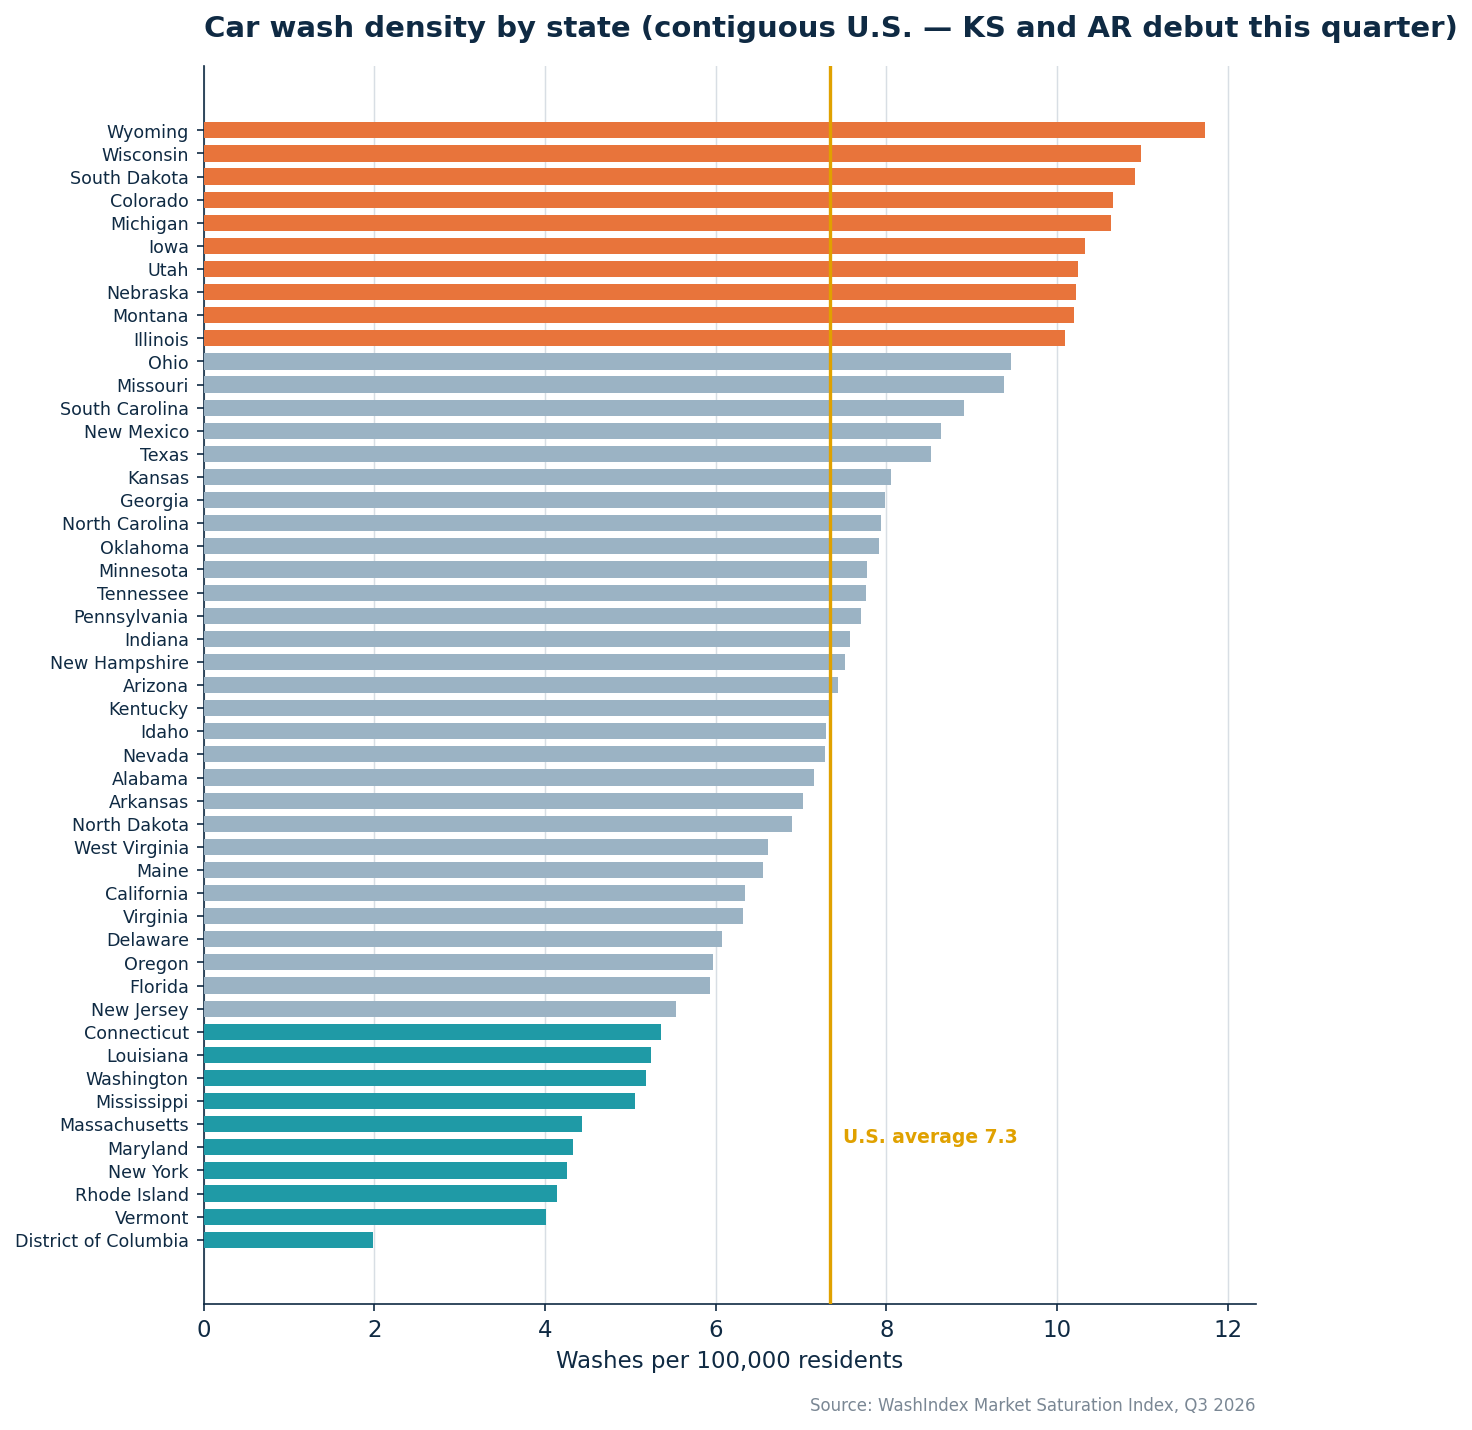
Exhibit 7 — Washes per 100,000 residents by state, contiguous U.S. Kansas and Arkansas debut this edition (see coverage notes).
| # | State | Washes | Per 100k | Over-capacity | Entry price | New (24 mo) | Gone dark | CBP 2022 |
|---|---|---|---|---|---|---|---|---|
| 1 | Wyoming | 69 | 11.7 | 33% | — | 23.2% | 0.0% | 60 |
| 2 | Wisconsin | 655 | 11.0 | 41% | $23 | 27.6% | 2.6% | 238 |
| 3 | South Dakota | 101 | 10.9 | 43% | — | 23.8% | 4.0% | 64 |
| 4 | Colorado | 635 | 10.7 | 47% | — | 16.5% | 1.1% | 387 |
| 5 | Michigan | 1,078 | 10.6 | 44% | $22 | 21.1% | 1.5% | 627 |
| 6 | Iowa | 335 | 10.3 | 34% | — | 22.7% | 4.5% | 304 |
| 7 | Utah | 359 | 10.2 | 48% | — | 14.2% | 1.1% | 266 |
| 8 | Nebraska | 205 | 10.2 | 45% | — | 18.0% | 2.0% | 171 |
| 9 | Montana | 116 | 10.2 | 39% | — | 19.0% | 4.3% | 95 |
| 10 | Illinois | 1,283 | 10.1 | 48% | $20 | 22.1% | 2.3% | 749 |
| 11 | Ohio | 1,124 | 9.5 | 40% | $22 | 15.6% | 1.2% | 693 |
| 12 | Missouri | 586 | 9.4 | 40% | — | 17.2% | 2.4% | 382 |
| 13 | South Carolina | 488 | 8.9 | 45% | — | 20.9% | 1.2% | 289 |
| 14 | New Mexico | 184 | 8.6 | 44% | — | 15.8% | 1.6% | 138 |
| 15 | Texas | 2,670 | 8.5 | 48% | $23 | 23.2% | 1.6% | 1,853 |
| 16 | Kansas | 239 | 8.1 | 0% | — | 13.4% | 3.8% | 208 |
| 17 | Georgia | 892 | 8.0 | 41% | — | 22.0% | 1.6% | 694 |
| 18 | North Carolina | 877 | 7.9 | 41% | — | 20.9% | 1.3% | 625 |
| 19 | Oklahoma | 324 | 7.9 | 48% | — | 18.8% | 2.8% | 232 |
| 20 | Minnesota | 450 | 7.8 | 34% | $25 | 21.1% | 2.7% | 227 |
| 21 | Tennessee | 561 | 7.8 | 37% | — | 20.1% | 0.9% | 338 |
| 22 | Pennsylvania | 1,007 | 7.7 | 40% | $20 | 12.0% | 1.5% | 630 |
| 23 | Indiana | 525 | 7.6 | 41% | $20 | 19.6% | 1.1% | 409 |
| 24 | New Hampshire | 106 | 7.5 | 40% | $25 | 11.3% | 2.8% | 86 |
| 25 | Arizona | 563 | 7.4 | 48% | $21 | 11.7% | 1.1% | 396 |
| 26 | Kentucky | 338 | 7.4 | 33% | — | 20.7% | 2.7% | 223 |
| 27 | Idaho | 146 | 7.3 | 43% | — | 22.6% | 1.4% | 131 |
| 28 | Nevada | 238 | 7.3 | 46% | $20 | 16.8% | 0.8% | 194 |
| 29 | Alabama | 369 | 7.2 | 38% | — | 16.8% | 1.9% | 220 |
| 30 | Arkansas | 217 | 7.0 | — | — | 19.8% | 2.8% | 164 |
| 31 | North Dakota | 55 | 6.9 | 46% | — | 20.0% | 3.6% | 65 |
| 32 | West Virginia | 117 | 6.6 | 27% | — | 26.5% | 1.7% | 73 |
| 33 | Maine | 92 | 6.5 | 28% | $25 | 18.5% | 4.3% | 65 |
| 34 | California | 2,501 | 6.3 | 47% | $23 | 16.8% | 1.7% | 2,262 |
| 35 | Virginia | 557 | 6.3 | 39% | — | 20.3% | 1.8% | 451 |
| 36 | Delaware | 64 | 6.1 | 41% | — | 23.4% | 1.6% | 58 |
| 37 | Oregon | 255 | 6.0 | 42% | $25 | 14.9% | 1.6% | 243 |
| 38 | Florida | 1,386 | 5.9 | 45% | $23 | 20.9% | 1.0% | 1,659 |
| 39 | New Jersey | 526 | 5.5 | 44% | $24 | 16.3% | 0.4% | 652 |
| 40 | Connecticut | 197 | 5.4 | 36% | $25 | 12.7% | 1.5% | 215 |
| 41 | Louisiana | 241 | 5.2 | 38% | — | 13.7% | 2.5% | 217 |
| 42 | Washington | 412 | 5.2 | 42% | $25 | 16.0% | 1.9% | 435 |
| 43 | Mississippi | 149 | 5.1 | 31% | — | 20.1% | 1.3% | 111 |
| 44 | Massachusetts | 316 | 4.4 | 42% | $25 | 16.5% | 2.5% | 444 |
| 45 | Maryland | 271 | 4.3 | 38% | — | 19.9% | 0.7% | 287 |
| 46 | New York | 847 | 4.3 | 42% | $25 | 15.7% | 0.8% | 929 |
| 47 | Rhode Island | 46 | 4.1 | 41% | $20 | 21.7% | 0.0% | 65 |
| 48 | Vermont | 26 | 4.0 | 8% | $27 | 19.2% | 0.0% | 27 |
| 49 | District of Columbia | 14 | 2.0 | 57% | — | 21.4% | 0.0% | 11 |
Wyoming, Wisconsin, and South Dakota are the most-washed states per capita; the District of Columbia, Vermont, and Rhode Island the least. Kansas (#16, 8.1 washes per 100k) and Arkansas (#30, 7.0) debut in the index this quarter, both landing mid-table. All ten of the densest states are in the Midwest or Mountain West — but the demand model shows much of that is climate-justified: what remains excessive after adjustment concentrates in the Great Lakes metros, not the Plains. (CBP counts only employer establishments, so it undercounts self-serve-heavy states; correlation with the WashIndex universe is r = 0.949.)
8. What this means
For PE and growth investors. The top-25 list is an underwriting screen — but v2 sharpens it: markets flagged by both the level index and the shakeout watch (Amarillo, Ann Arbor, Lincoln, Sioux Falls) are where membership discounting and churn arrive first. The whitespace list is now demand-proofed: Bridgeport, Knoxville, Chattanooga, and Tuscaloosa are busy-wash, thin-supply markets, not statistical artifacts of transit, climate, or review-solicitation campaigns.
For multi-site operators. If your footprint sits in Section 5.1 (McAllen, Beaumont, Green Bay, Colorado Springs), the next four quarters are about defense: membership lock-in, service quality, local brand. Watch the going-dark table — exits there are your acquisition pipeline at distressed prices.
For site selectors and suppliers. Follow demand-adjusted whitespace plus organic utilization: the median wash in Knoxville, Tuscaloosa, Brownsville, and Provo earns 21–27 Local Guide reviews a year — roughly triple the level in Chicago — against thin or modest supply. That is where new equipment goes to work fastest.
Appendix — methodology and coverage (v2.0)
A. Universe and geography
The index is computed on the WashIndex “professional set”: 24,812 car wash locations in the contiguous United States plus DC, classified as express tunnel, in-bay automatic, full-service, or self-serve bay; verified active; detail shops and non-competitor locations excluded. Alaska and Hawaii are outside the index scope — island and exclave supply dynamics are not comparable to contiguous-U.S. markets — which removes Anchorage and Urban Honolulu from the rankings. Each wash is assigned to a county by point-in-polygon against Census 2023 cartographic boundaries from its coordinates (100.0% of the universe; ZIP-based fallback for the remainder), then to its CBSA under OMB July-2023 delineations.
B. The expected-supply (demand) model
Rather than compare metros on raw per-capita density, v2 fits an OLS model of log washes-per-100k on six standardized demand fundamentals across the 193 ranked metros: snow days, winter minimum temperature, annual precipitation (station-interpolated to wash locations), drive-alone commute share (ACS B08301), log median household income (B19013), and vehicles per capita (B25046 / population). The model explains 32% of cross-metro density variation; colder winters, more driving, and more vehicles all predict more washes. The demand-adjusted density component is the model residual — how far a metro’s actual supply sits above or below what its fundamentals support.
C. The composite
Four components, each z-scored (winsorized ±2.5, neutral imputation where a signal is unavailable) and equally weighted: demand-adjusted density, capacity strain (share of washes in trade areas at or above modeled capacity on the Local Guide demand model, wash.OpportunityScoreLG), inverted median Local Guide review velocity, and inverted median unlimited entry price. Utilization and strain deliberately use Local Guide reviews only — organic reviewers, resistant to solicitation campaigns — while going-dark and new-entrant dating use the full review corpus (any sign of life). We evaluated PCA-derived and outcome-calibrated weights and rejected both for this edition — PC1 collapses to a density-strain axis that ignores utilization and price, and calibration against going-dark rates is underpowered at 415 national exits. Equal weighting is the robust default for co-equal signals, and the ranking is insensitive to the choice: across 80 alternative weightings (every component ±40%), rank correlation stays between 0.88 and 1.00 (median 0.96) and a median of 20 of the top-25 metros are unchanged.
The composite is multiplied by a reliability factor n/(n+25) (empirical-Bayes shrinkage toward the mean), converted to a 0–100 percentile, and tagged with a confidence tier (High ≥100 washes, Medium 40–99, Low <40).
D. Momentum indicators (reported, not in the composite)
- Going-dark rate — share of washes with 10+ lifetime reviews whose last review is older than both 12 months and 5× the wash’s own historical review cadence.
- Supply-vs-demand growth gap — annualized share of supply added in the trailing 24 months (first-review dating) minus 2020–24 population CAGR.
- Net entry — new-entrant share minus going-dark share.
The level composite correlates positively with observed going-dark rates (r = 0.14); as shakeout history accumulates across editions, these outcomes will be used to calibrate component weights.
E. Data sources and vintages
- WashIndex location index and review corpus with Local Guide reviewer flags (reviews through 2026-05-31; Local Guide opportunity-model snapshot 2026-06-01, v0.6.0); scraped membership pricing for 5,074 washes (price signal published for the 115 metros with 5+ priced washes; neutral elsewhere).
- U.S. Census Bureau Vintage-2024 county/state population estimates (2020 and 2024).
- ACS 2019–2023 5-year: B25046 (vehicles), B08301 (commute mode), B19013 (income).
- NOAA-station-interpolated climate at wash ZIP codes (WashIndex).
- OMB CBSA delineations, July 2023; Census 2023 county cartographic boundaries.
- Census County Business Patterns 2022, NAICS 811192 (external validation, state-level r = 0.949).
F. Coverage notes (Q2 2026)
- Index scope is the contiguous U.S. plus DC. Alaska and Hawaii (and therefore Anchorage and Urban Honolulu) are excluded: island/exclave supply dynamics are not comparable to contiguous-U.S. markets.
- Kansas and Arkansas debut this edition (456 washes), bringing Kansas City, Wichita, Little Rock, Fayetteville-Springdale-Rogers, and full Memphis coverage into the rankings. Their review data landed after this quarter’s canonical taxonomy and capacity-model snapshots, so their activity and review fields were derived directly from the review corpus using the validated canonical definitions.
- Metros marked ‡ (Wichita, Little Rock, Fayetteville) debut without capacity-model and price-scrape coverage — those two signals are neutral in their scores this quarter and complete in Q4 2026. Kansas City is fully scored via its Missouri-side trade areas.
- Review-derived signals reflect collection through 2026-05-31.
G. How to cite
WashIndex, “Car Wash Market Saturation Index — Q2 2026,” washindex.com. Data through 2026-06-30. Journalists and analysts may reproduce any table or chart with attribution. The full 360-metro dataset — every component metric for every metro above 100,000 residents — is available on request.
H. About WashIndex
WashIndex is the data layer for the U.S. carwash industry — a location-level index of every professional wash in the country, scored on quality, sentiment, pricing, and investability. Operators, brokers, and capital partners use WashIndex to underwrite, benchmark, and source. Book a 20-minute demo at washindex.com.