Introducing WashIndex 1.0
WashIndex started as a blog post. Several months later, it has become an invaluable product for operators, multi-state chains, and private-equity buyers across the country to evaluate car washes around the United States. This is what’s inside the platform.
From a Sparkle Technologies blog post to a real product
In early 2026, the data science team at Sparkle Technologies published a write-up on what becomes possible when modern AI is combined with rigorous data engineering and granular geospatial datasets. The proof of concept covered a single market: Dallas-Fort Worth. 502,391 Google reviews, 1,725 car wash locations, 96 cities — assembled into an interactive 3D heatmap, scored against customer-experience pillars by NLP models, and overlaid with census-tract demographics and DOT traffic counts.
The piece was meant as a technical demonstration, but due to demand, we decided to build it out into a real product. WashIndex v1.0 is what came out the other side.
Every car wash in every U.S. state
WashIndex covers every car wash in the United States. Not ‘every major MSA.’ Not ‘top 50 metros.’ Every car wash, in every state — major metros, small towns, suburban arterials, rural highway corners. If it’s a car wash and it’s in the United States, it’s on the map.
The numbers behind that:
- Over 12 million customer reviews ingested and AI-scored.
- Over 80,000 tracked car wash locations.
- Census-tract demographic overlays — median household income, population density, median home value — wired in nationally.
- Real-time traffic counts from state and federal departments of transportation, used for drive-time isochrones rather than naive radius circles.
AI review processing: seven pillars and 55 signals
We don’t stop at star ratings. Every review is run through an AI processing pipeline that scores it across two structured layers.
Seven pillars form the high-level customer-experience model. These are the dimensions that consistently drive ratings across the industry, and they back every quality benchmark on the platform:
- Wash Quality
- Customer Service
- Price & Value
- Speed & Wait Time
- Facilities
- Detailing
- Overall Experience
Underneath the pillars, every review is also scored against 55 granular signals. Where the pillars tell you the ‘what’ (customer service is weak in this market), the signals tell you the ‘why’ — specifically. A handful of examples:
- Damage Rate — frequency and severity of damage-related complaints.
- Membership Value — sentiment about membership pricing and perceived benefit.
- Staff Score — friendliness, helpfulness, and consistency of on-site staff.
- Wait-Time Pain — magnitude and recency of wait-time complaints.
- …and 51 more.
The roll-up structure means a single review contributes to multiple signals, which feed multiple pillars, which feed location-level benchmarks. By the time you see a score on a location card, it’s the aggregation of every word every customer has ever written about that wash.
Reading every car wash’s website
Reviews are only half the story. The customer-experience layer tells you how a wash is performing; the operational layer tells you what kind of wash it is in the first place.
For every location in the country, we read the operator’s website (or note its absence), mine its menu and pricing, and classify the wash by format:
- Express Tunnel
- Full Service
- Self-Serve Bay
- In-Bay Automatic
- Detail Shop
- Unclassified — where the data isn’t enough to decide with confidence.
This matters because format defines the competitive set. Comparing an Express Tunnel against a Self-Serve Bay tells you nothing useful — they’re competing for different customers, different occasions, different price points. Without format classification, every benchmark on the platform would be noise.
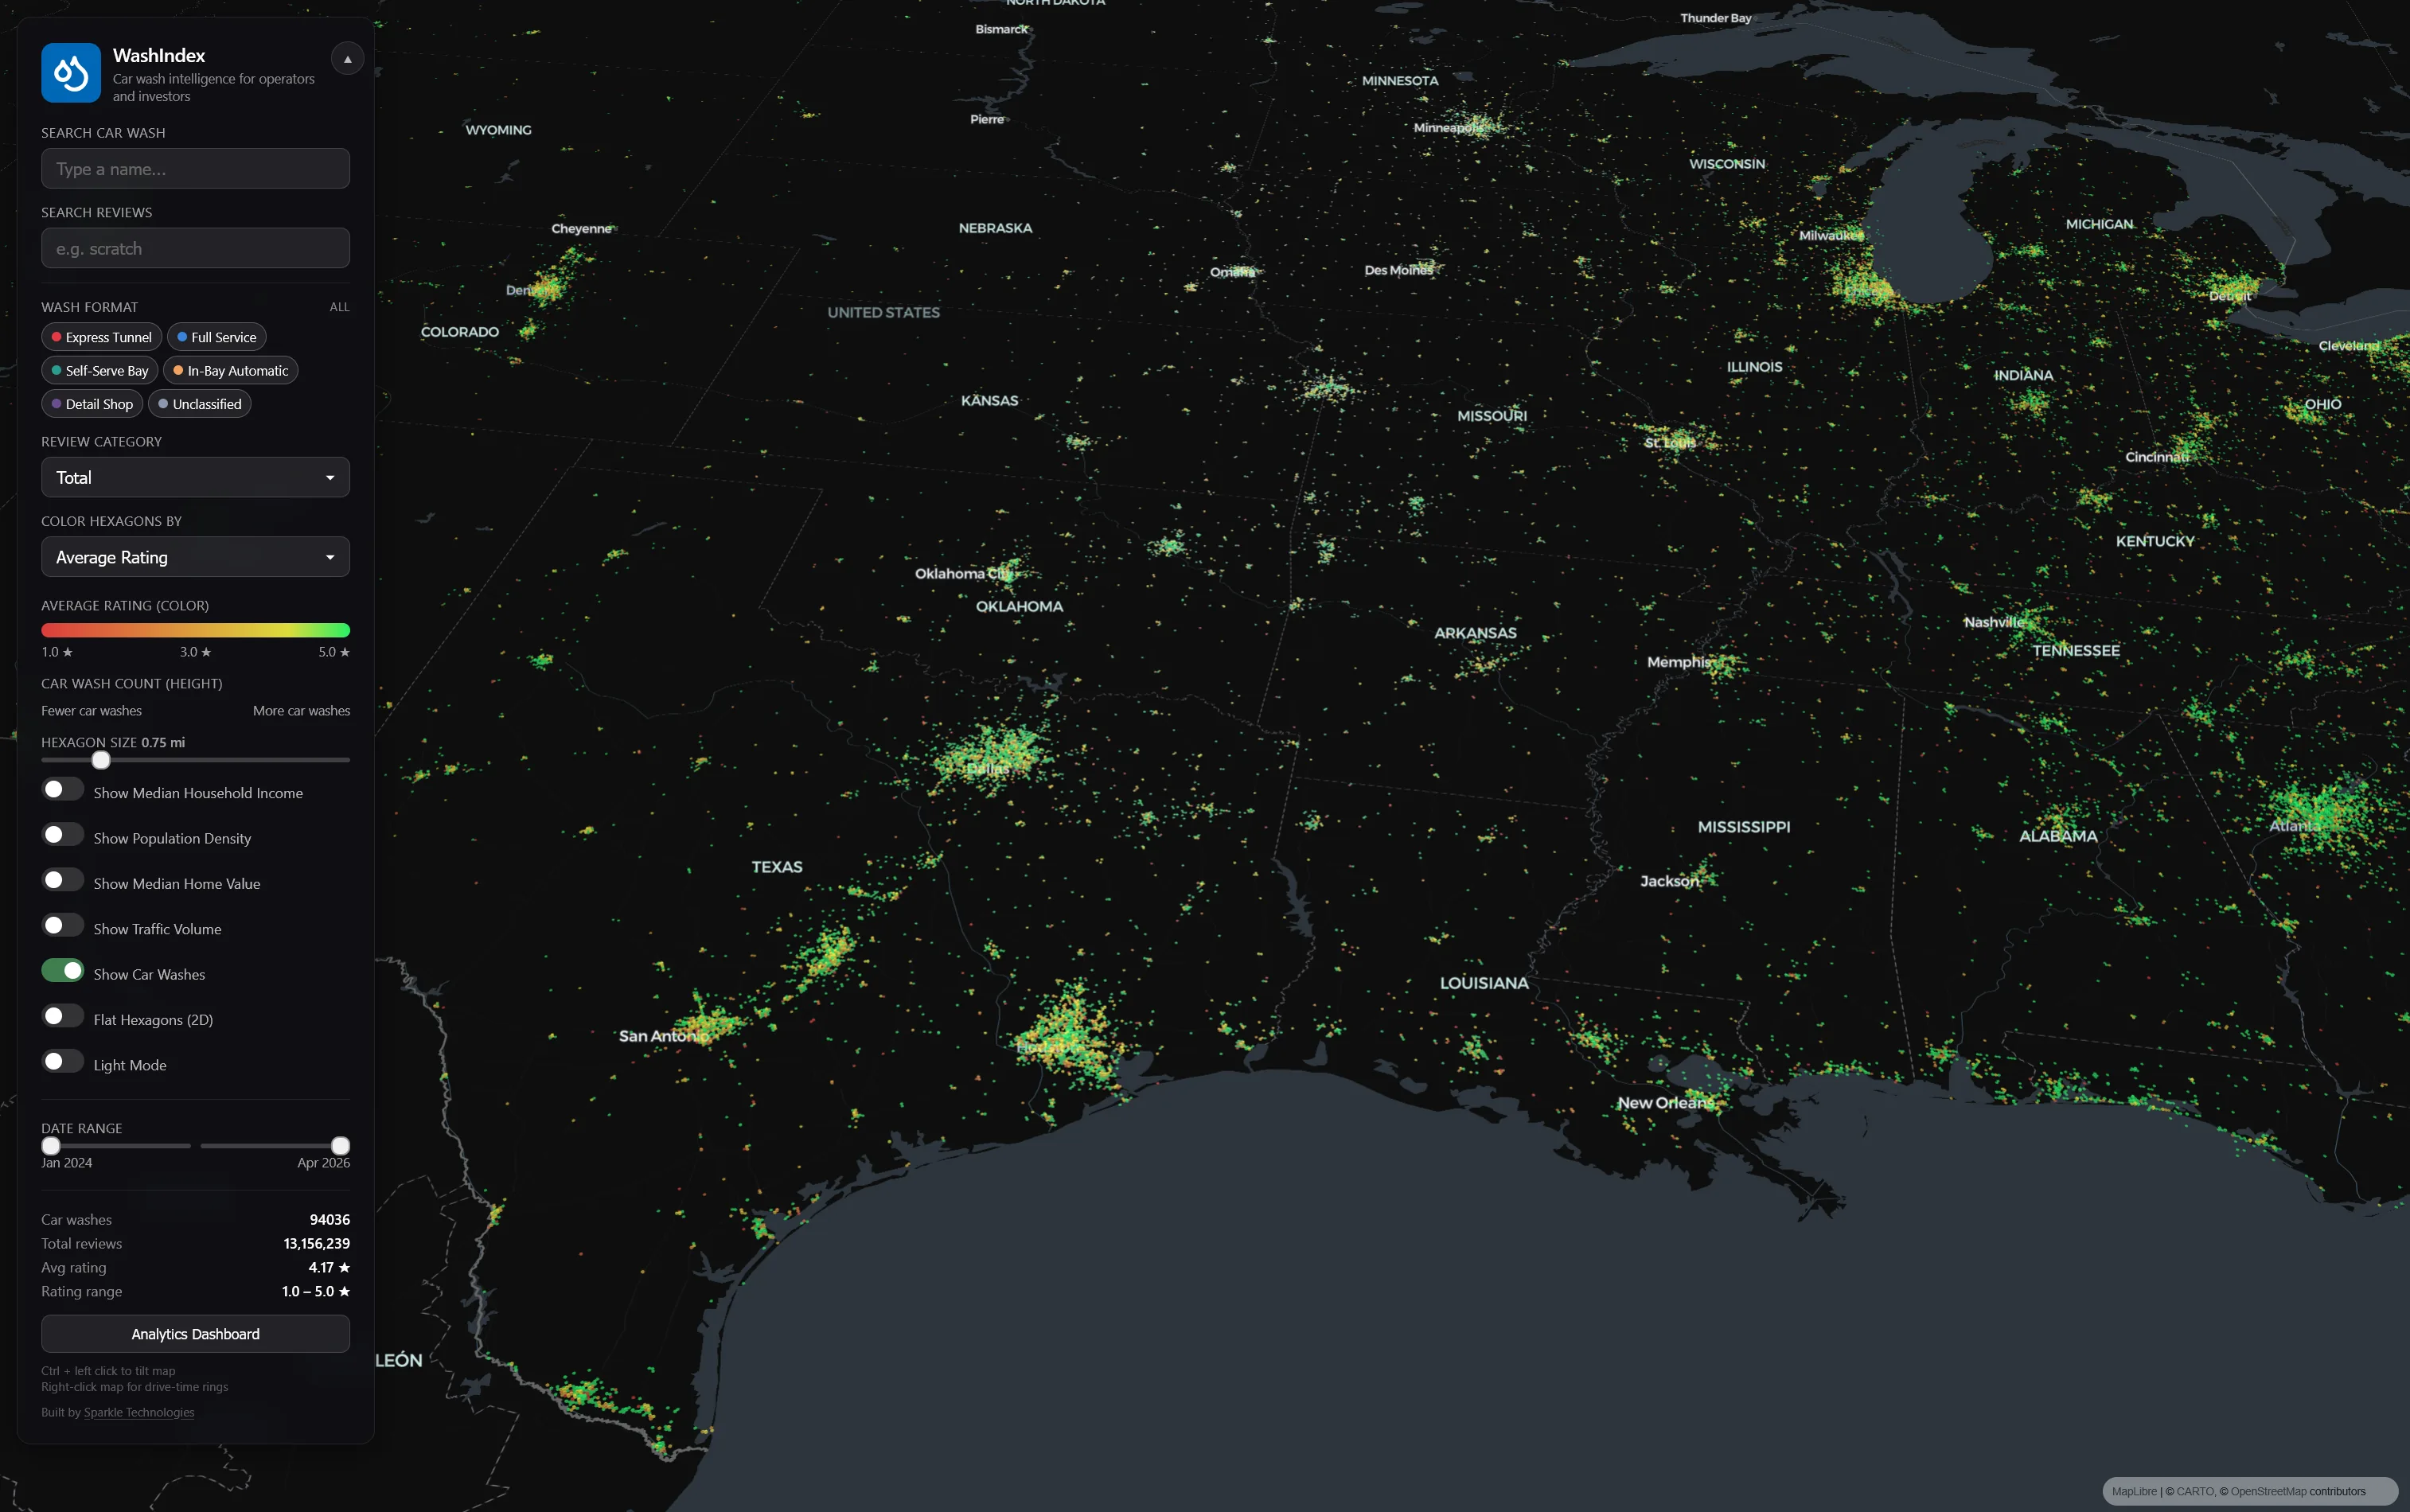
The 3D heatmap
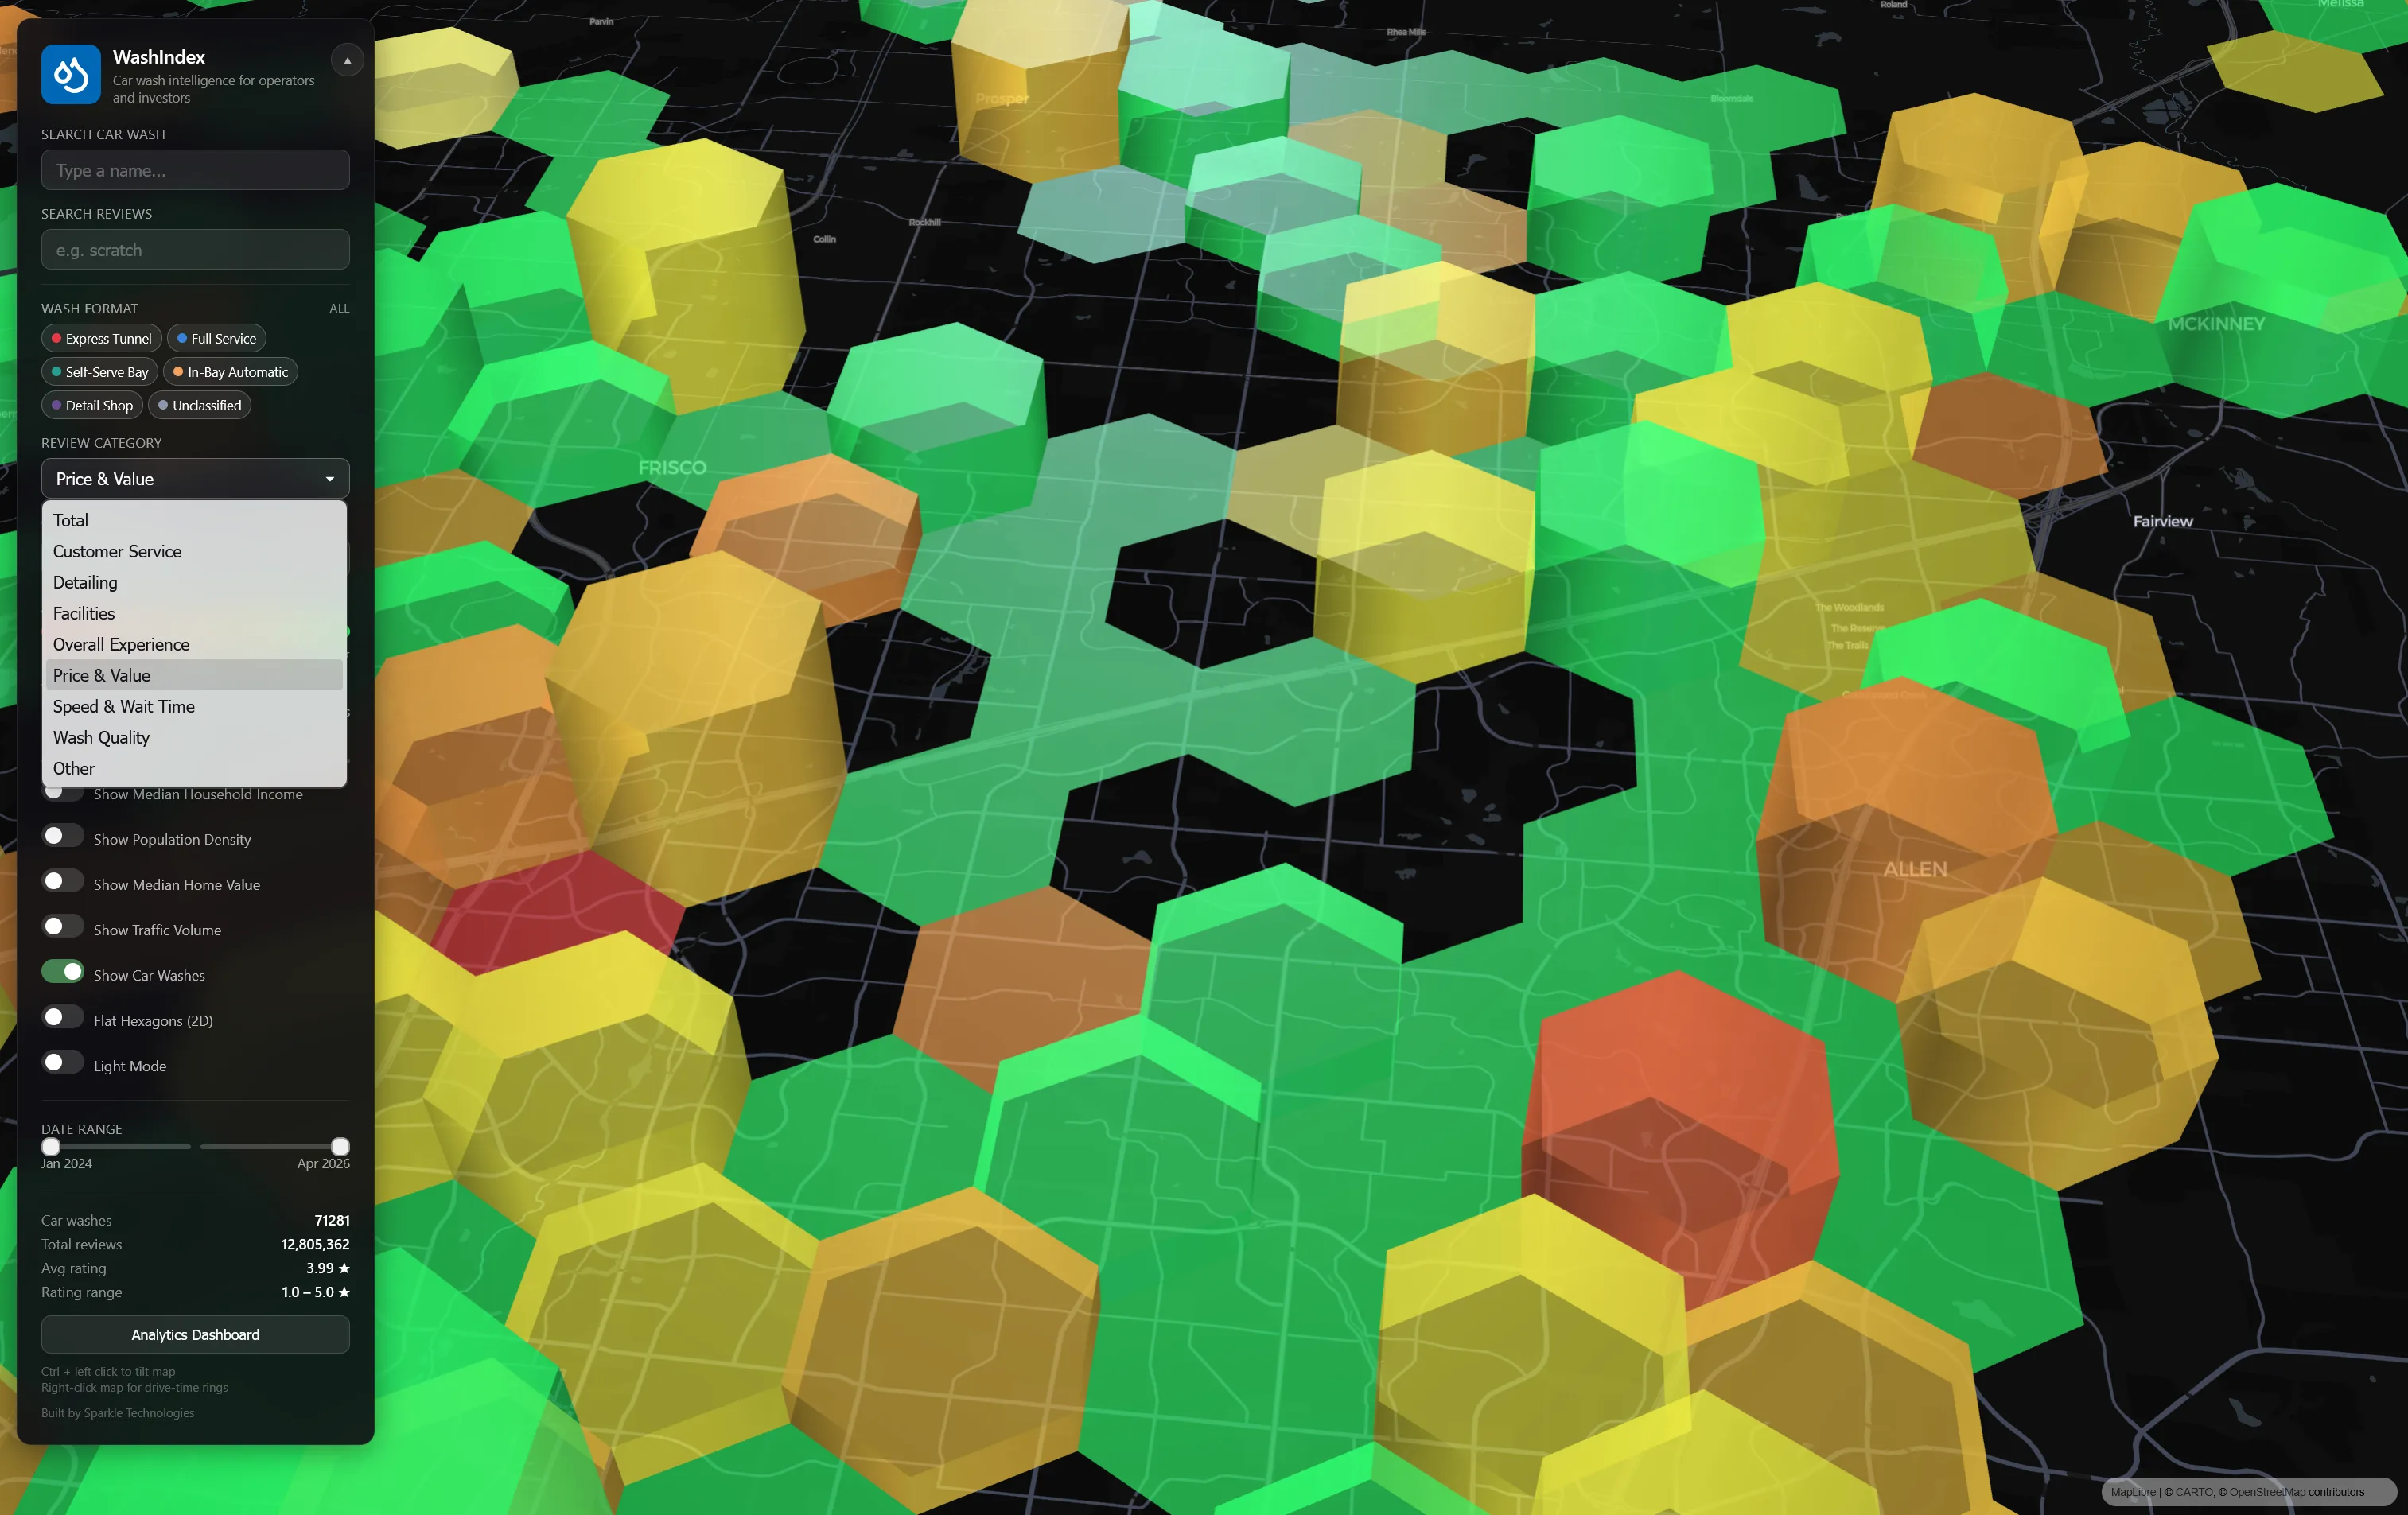
The core of the platform is a 3D hexagonal heatmap built on top of the U.S. road network. Each hexagon represents a geographic cluster of car washes. The height encodes density — taller hexagons mean more car washes in that area. The color encodes performance — green means high average ratings, red means low.
At the metro-wide zoom level, you immediately see patterns that would take weeks to discover manually: where car washes are concentrated, where there are gaps, and where customer satisfaction is lagging.
Zoom in and the hexagons seamlessly transition into individual location markers. Each dot is a car wash, colored by its rating, sized by its review volume. You can toggle between 3D extruded hexagons and a flat 2D view, and switch between dark and light map styles depending on what you’re presenting.
Click anything, get everything
Every element on the map is interactive. Hover over a hexagon and you get a quick summary — the number of car washes in that area, their average rating, an opportunity score, a radar chart showing category strengths and weaknesses, and a list of every car wash with individual ratings and review counts.
Click the hexagon and you get the full deep-dive: a monthly rating trend sparkline, category-by-category ratings with bar charts, a star distribution breakdown, and the most common review tags extracted from the text — things like ‘suction,’ ‘machine,’ ‘towels,’ and ‘subscription.’ These tags surface the operational themes that matter most to customers in that area.
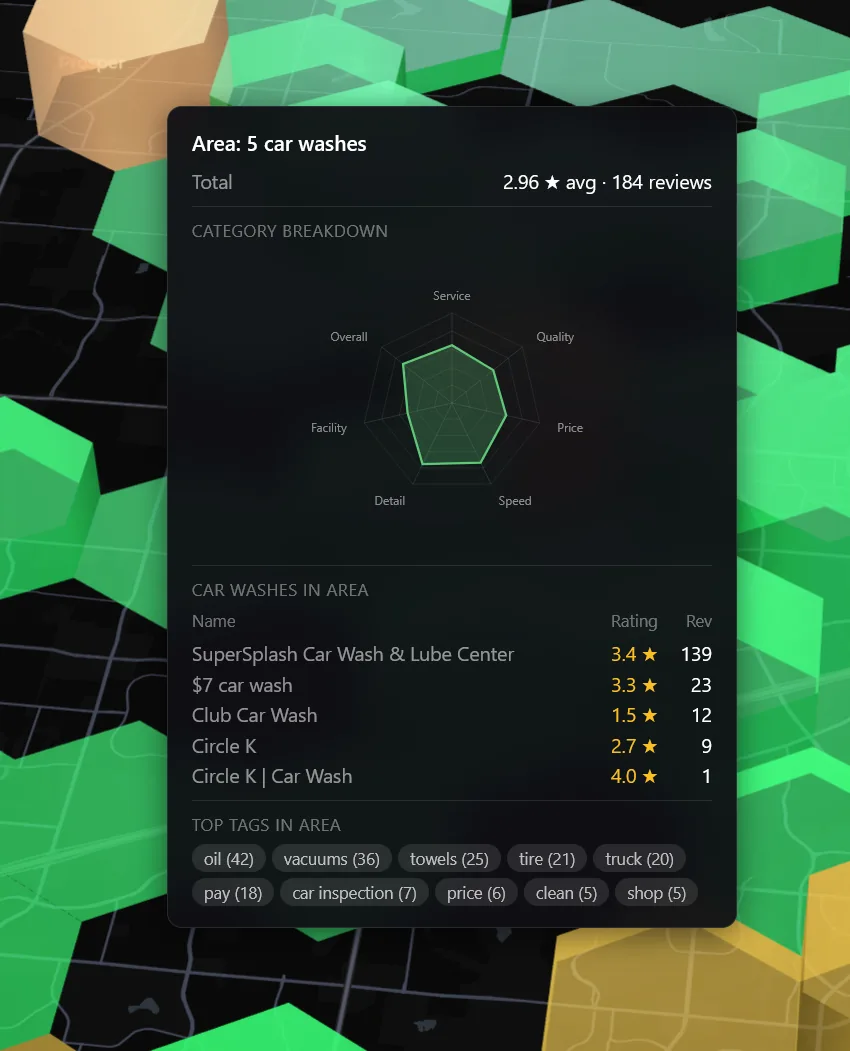 Hover any hexagon for a quick area summary. | 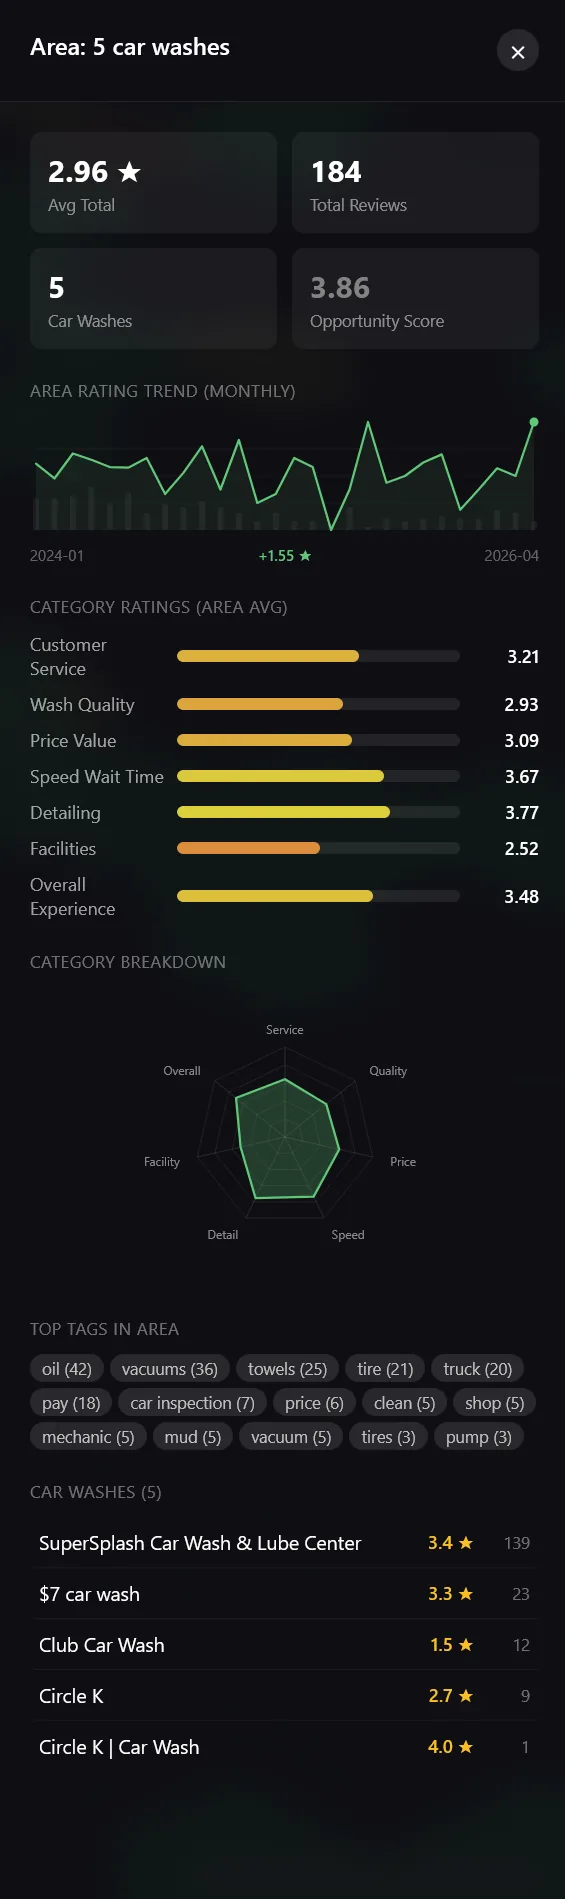 Click for the full detail panel — trends, category scores, and review tags. |
The same interaction model works at the individual car wash level. Hover for a quick glance, click for the full panel.
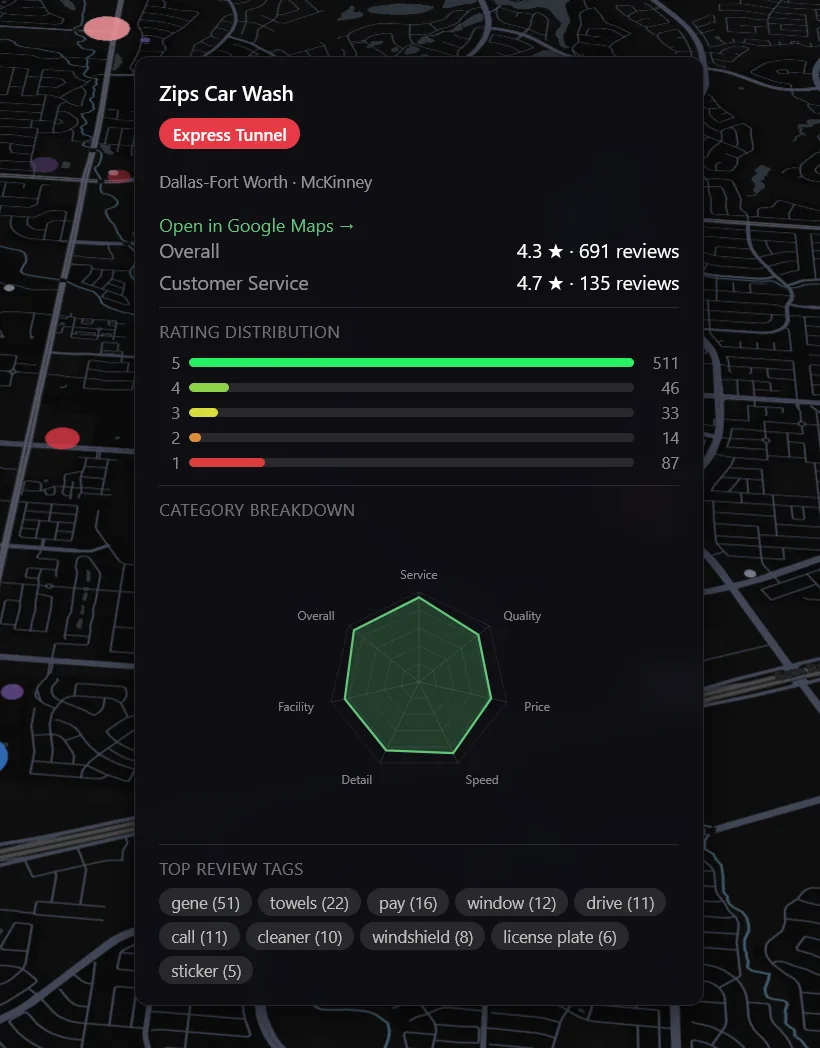 Hover any car wash for ratings, distribution, and top tags. | 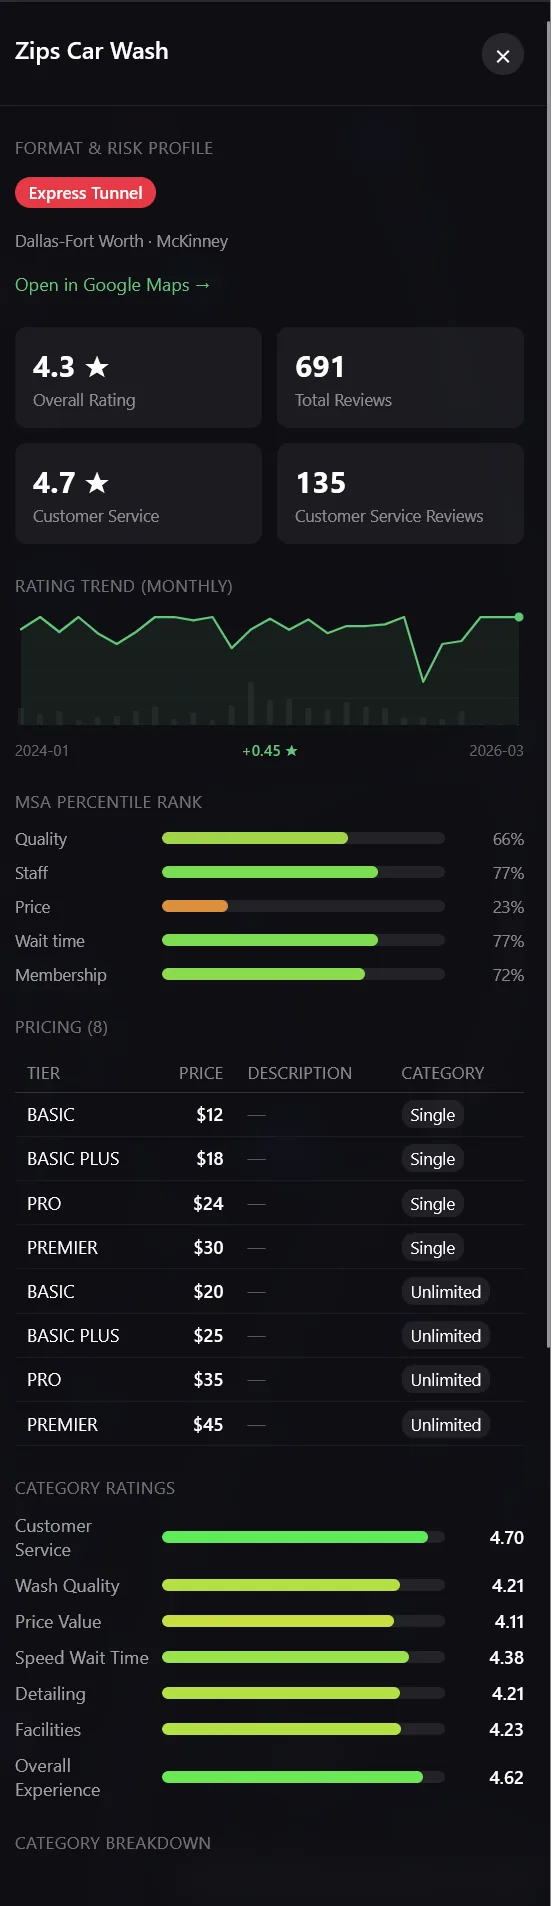 The full per-wash detail panel. |
Filter by what matters
A star rating tells you almost nothing about why customers feel the way they do. A 3.5-star car wash might have excellent wash quality but terrible wait times — or great facilities with rude staff. The aggregate number hides the story.
Because every review is scored across the seven pillars, you can filter the entire map by any single category — instantly reshaping the view to show which areas excel or struggle in that specific dimension. If you operate detailing services and want to see how you rank on detail quality alone, switch the filter to Detailing and watch the map redraw against just that criterion.
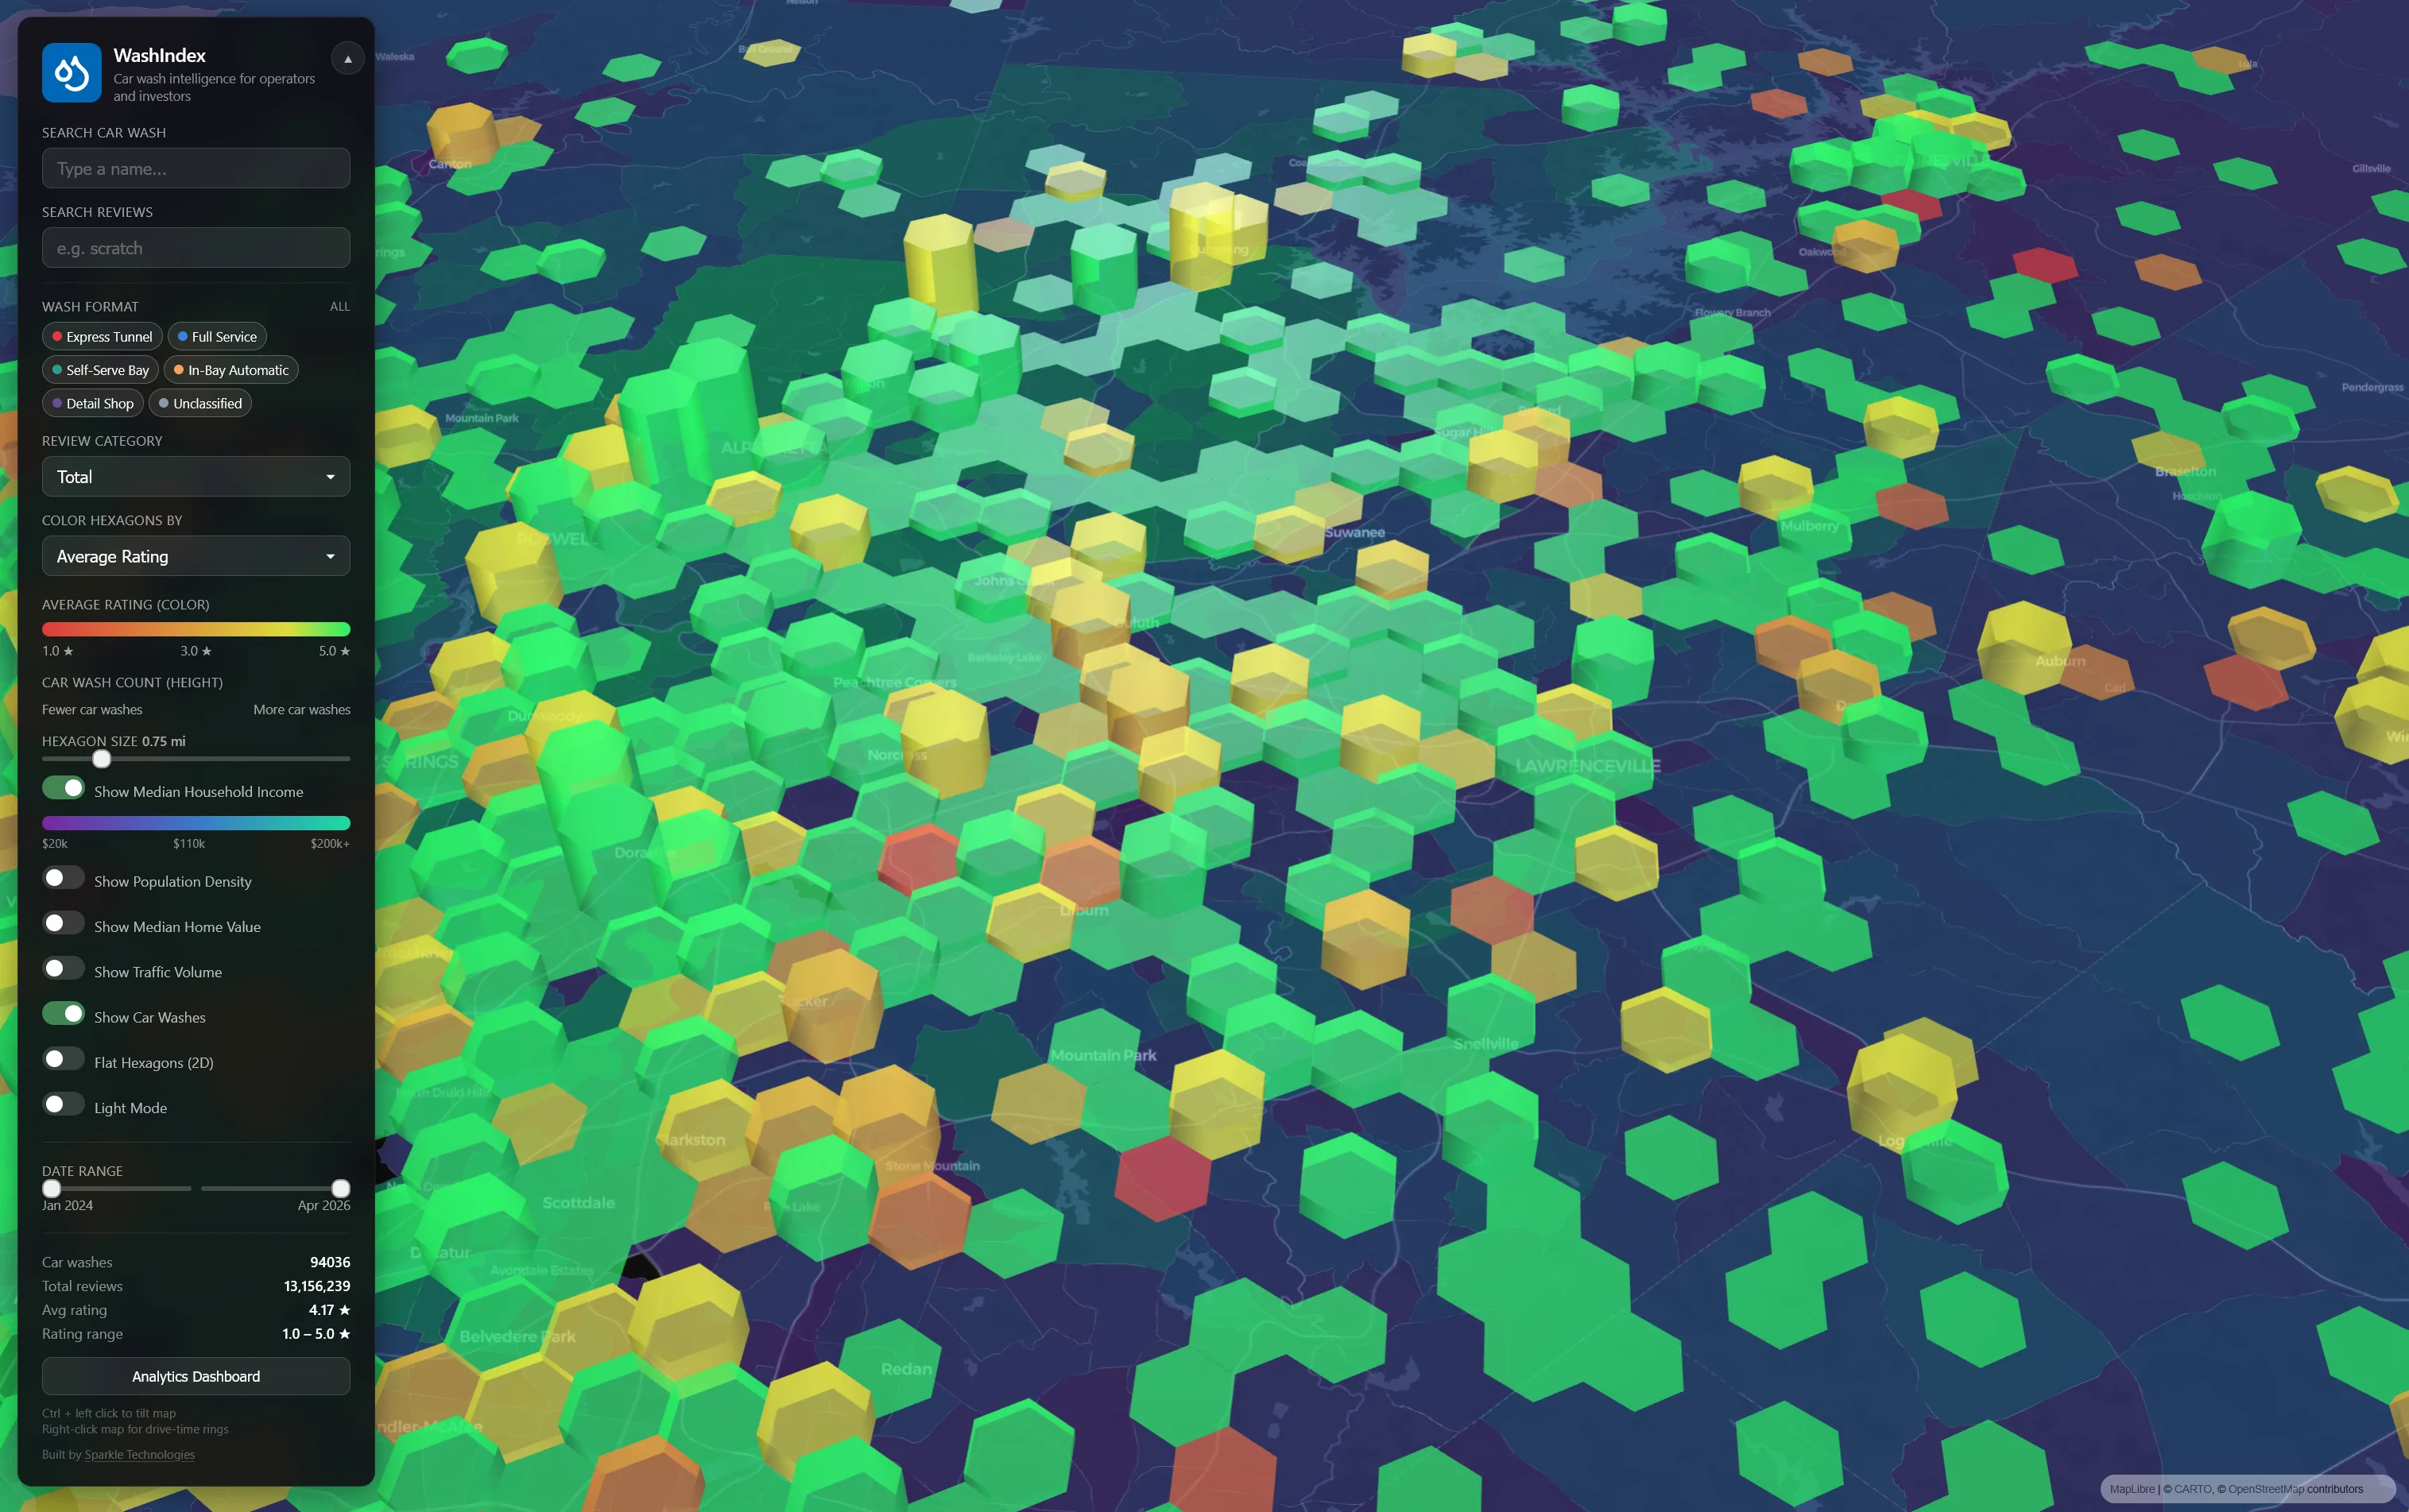
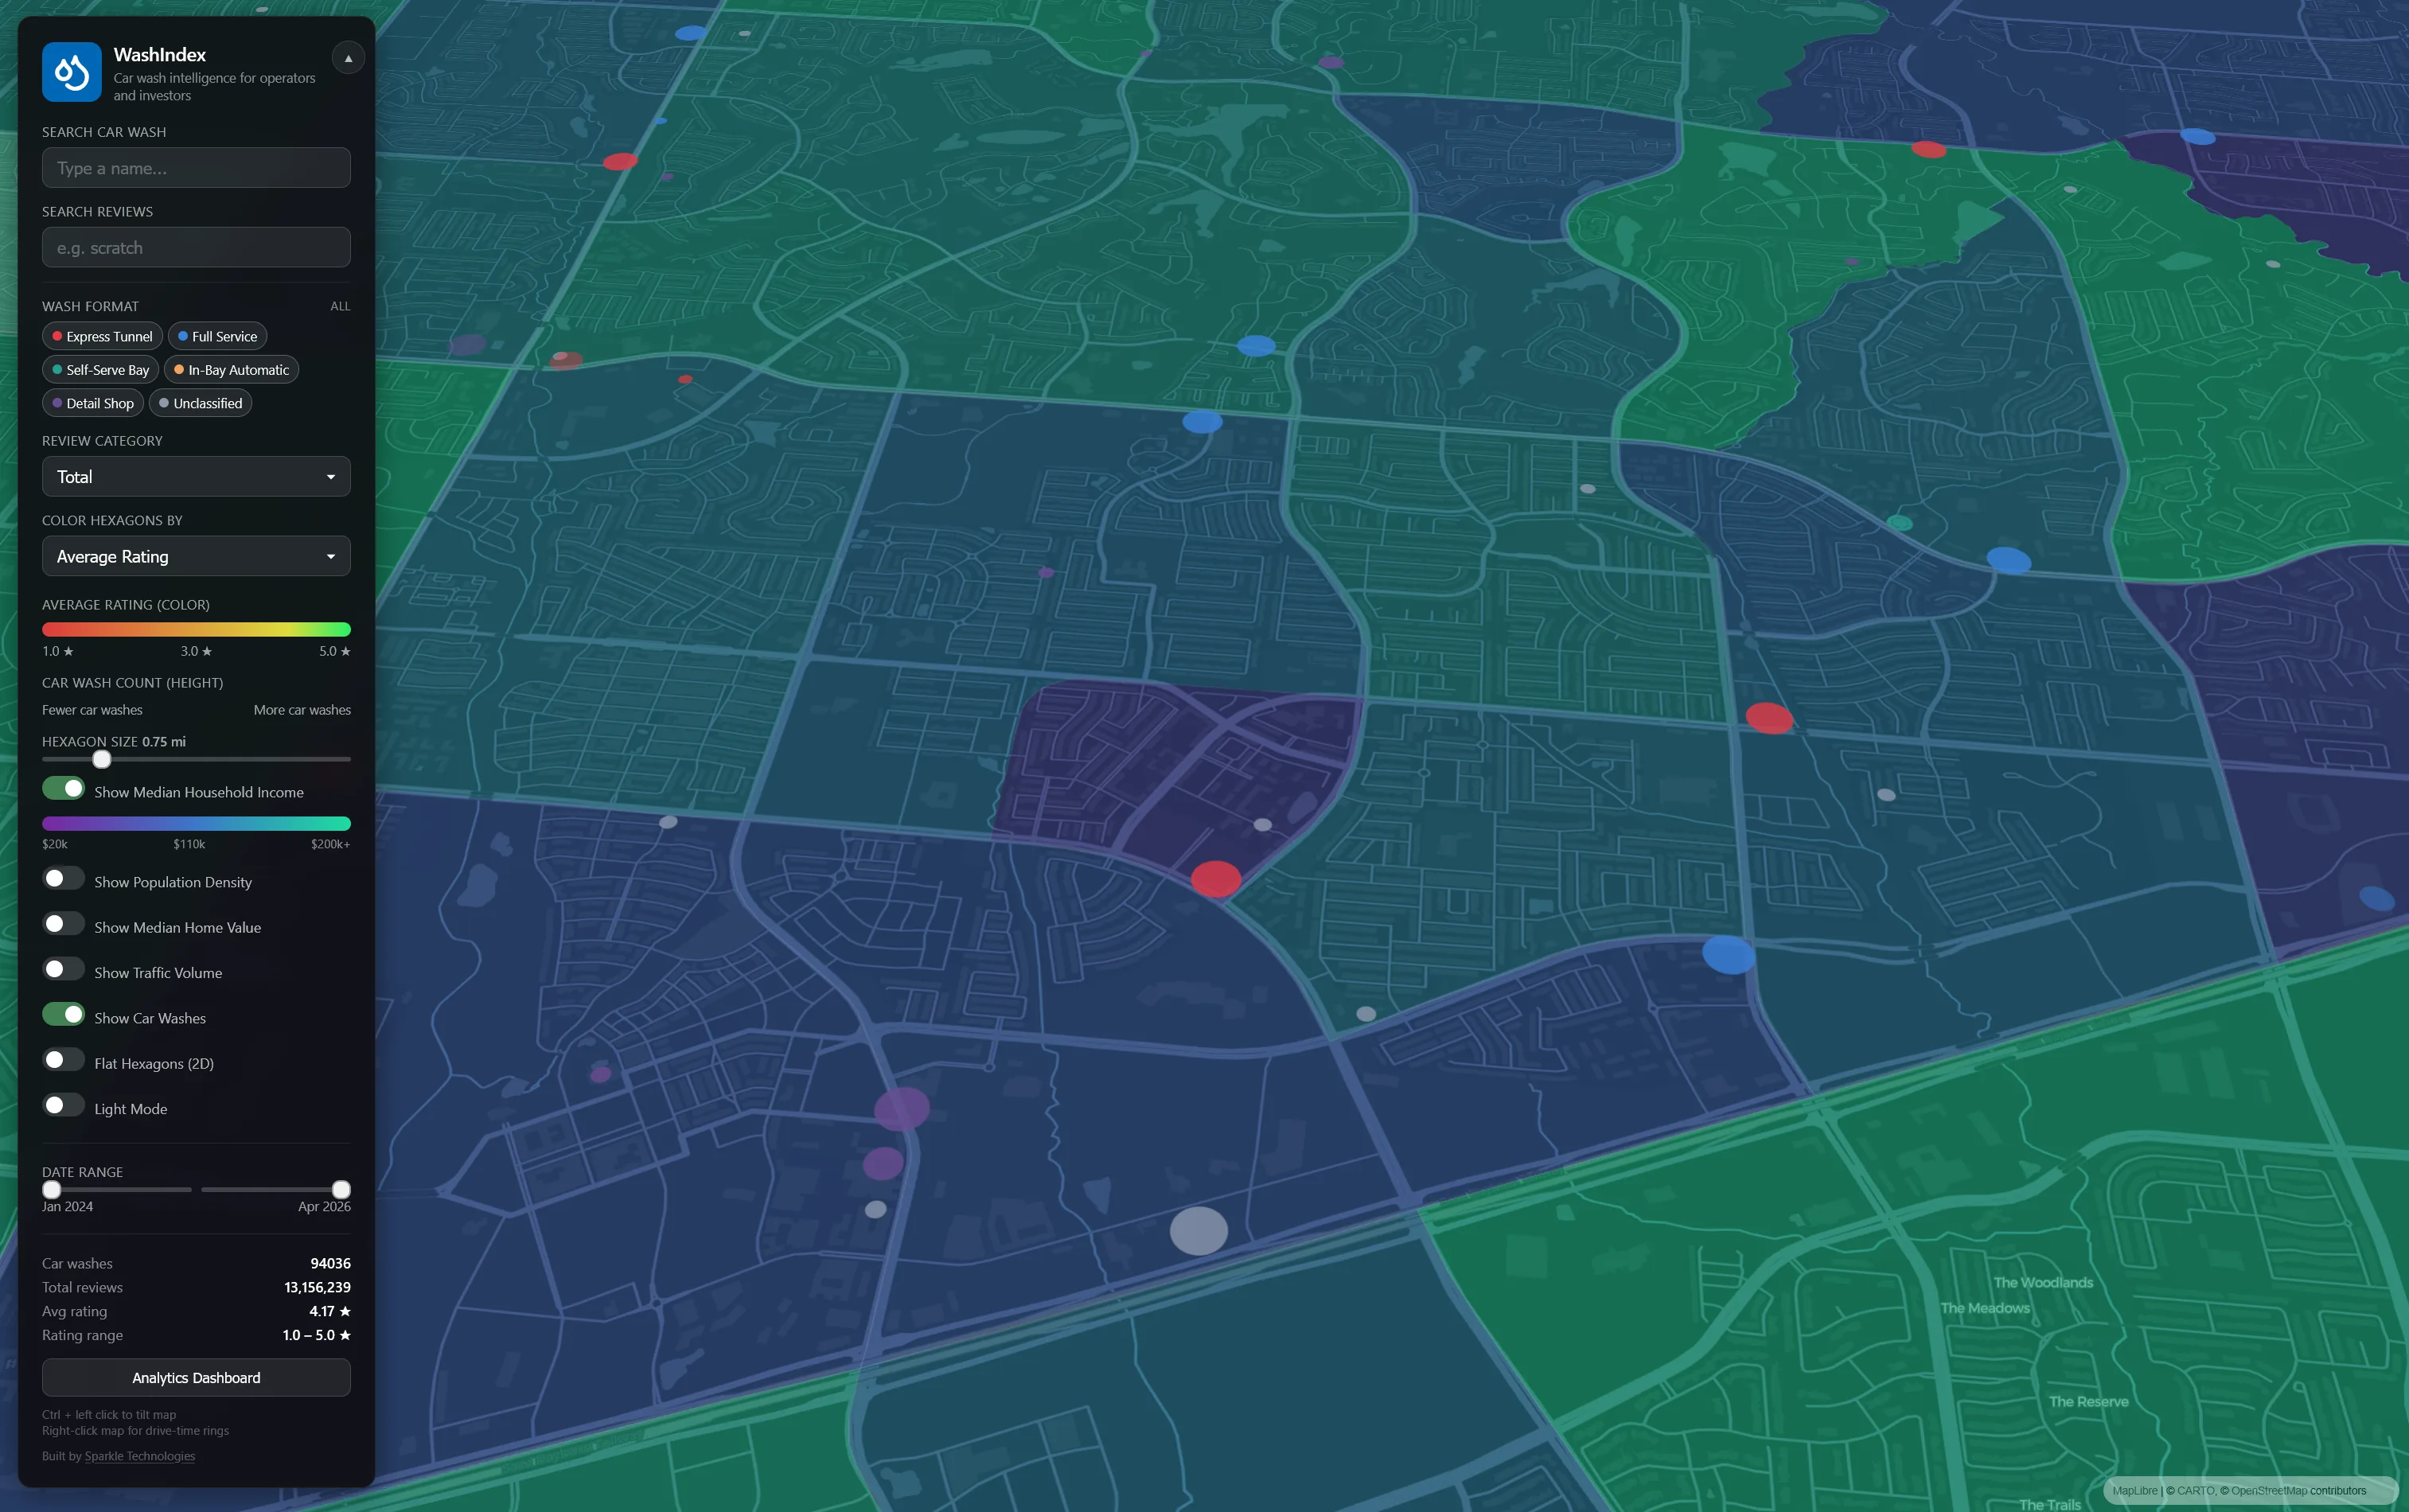
Demographic and traffic overlays
A car wash’s success depends as much on where it sits as how it operates. The platform layers in three census-tract demographic overlays — median household income, population density, and median home value — all rendered as color-coded choropleth maps that you can toggle on and off independently.
We also integrate DOT traffic volume data, showing average annual daily traffic counts for road segments across the country. Toggle it on and the roads themselves get colored by their traffic load. Hover any segment for the exact count.
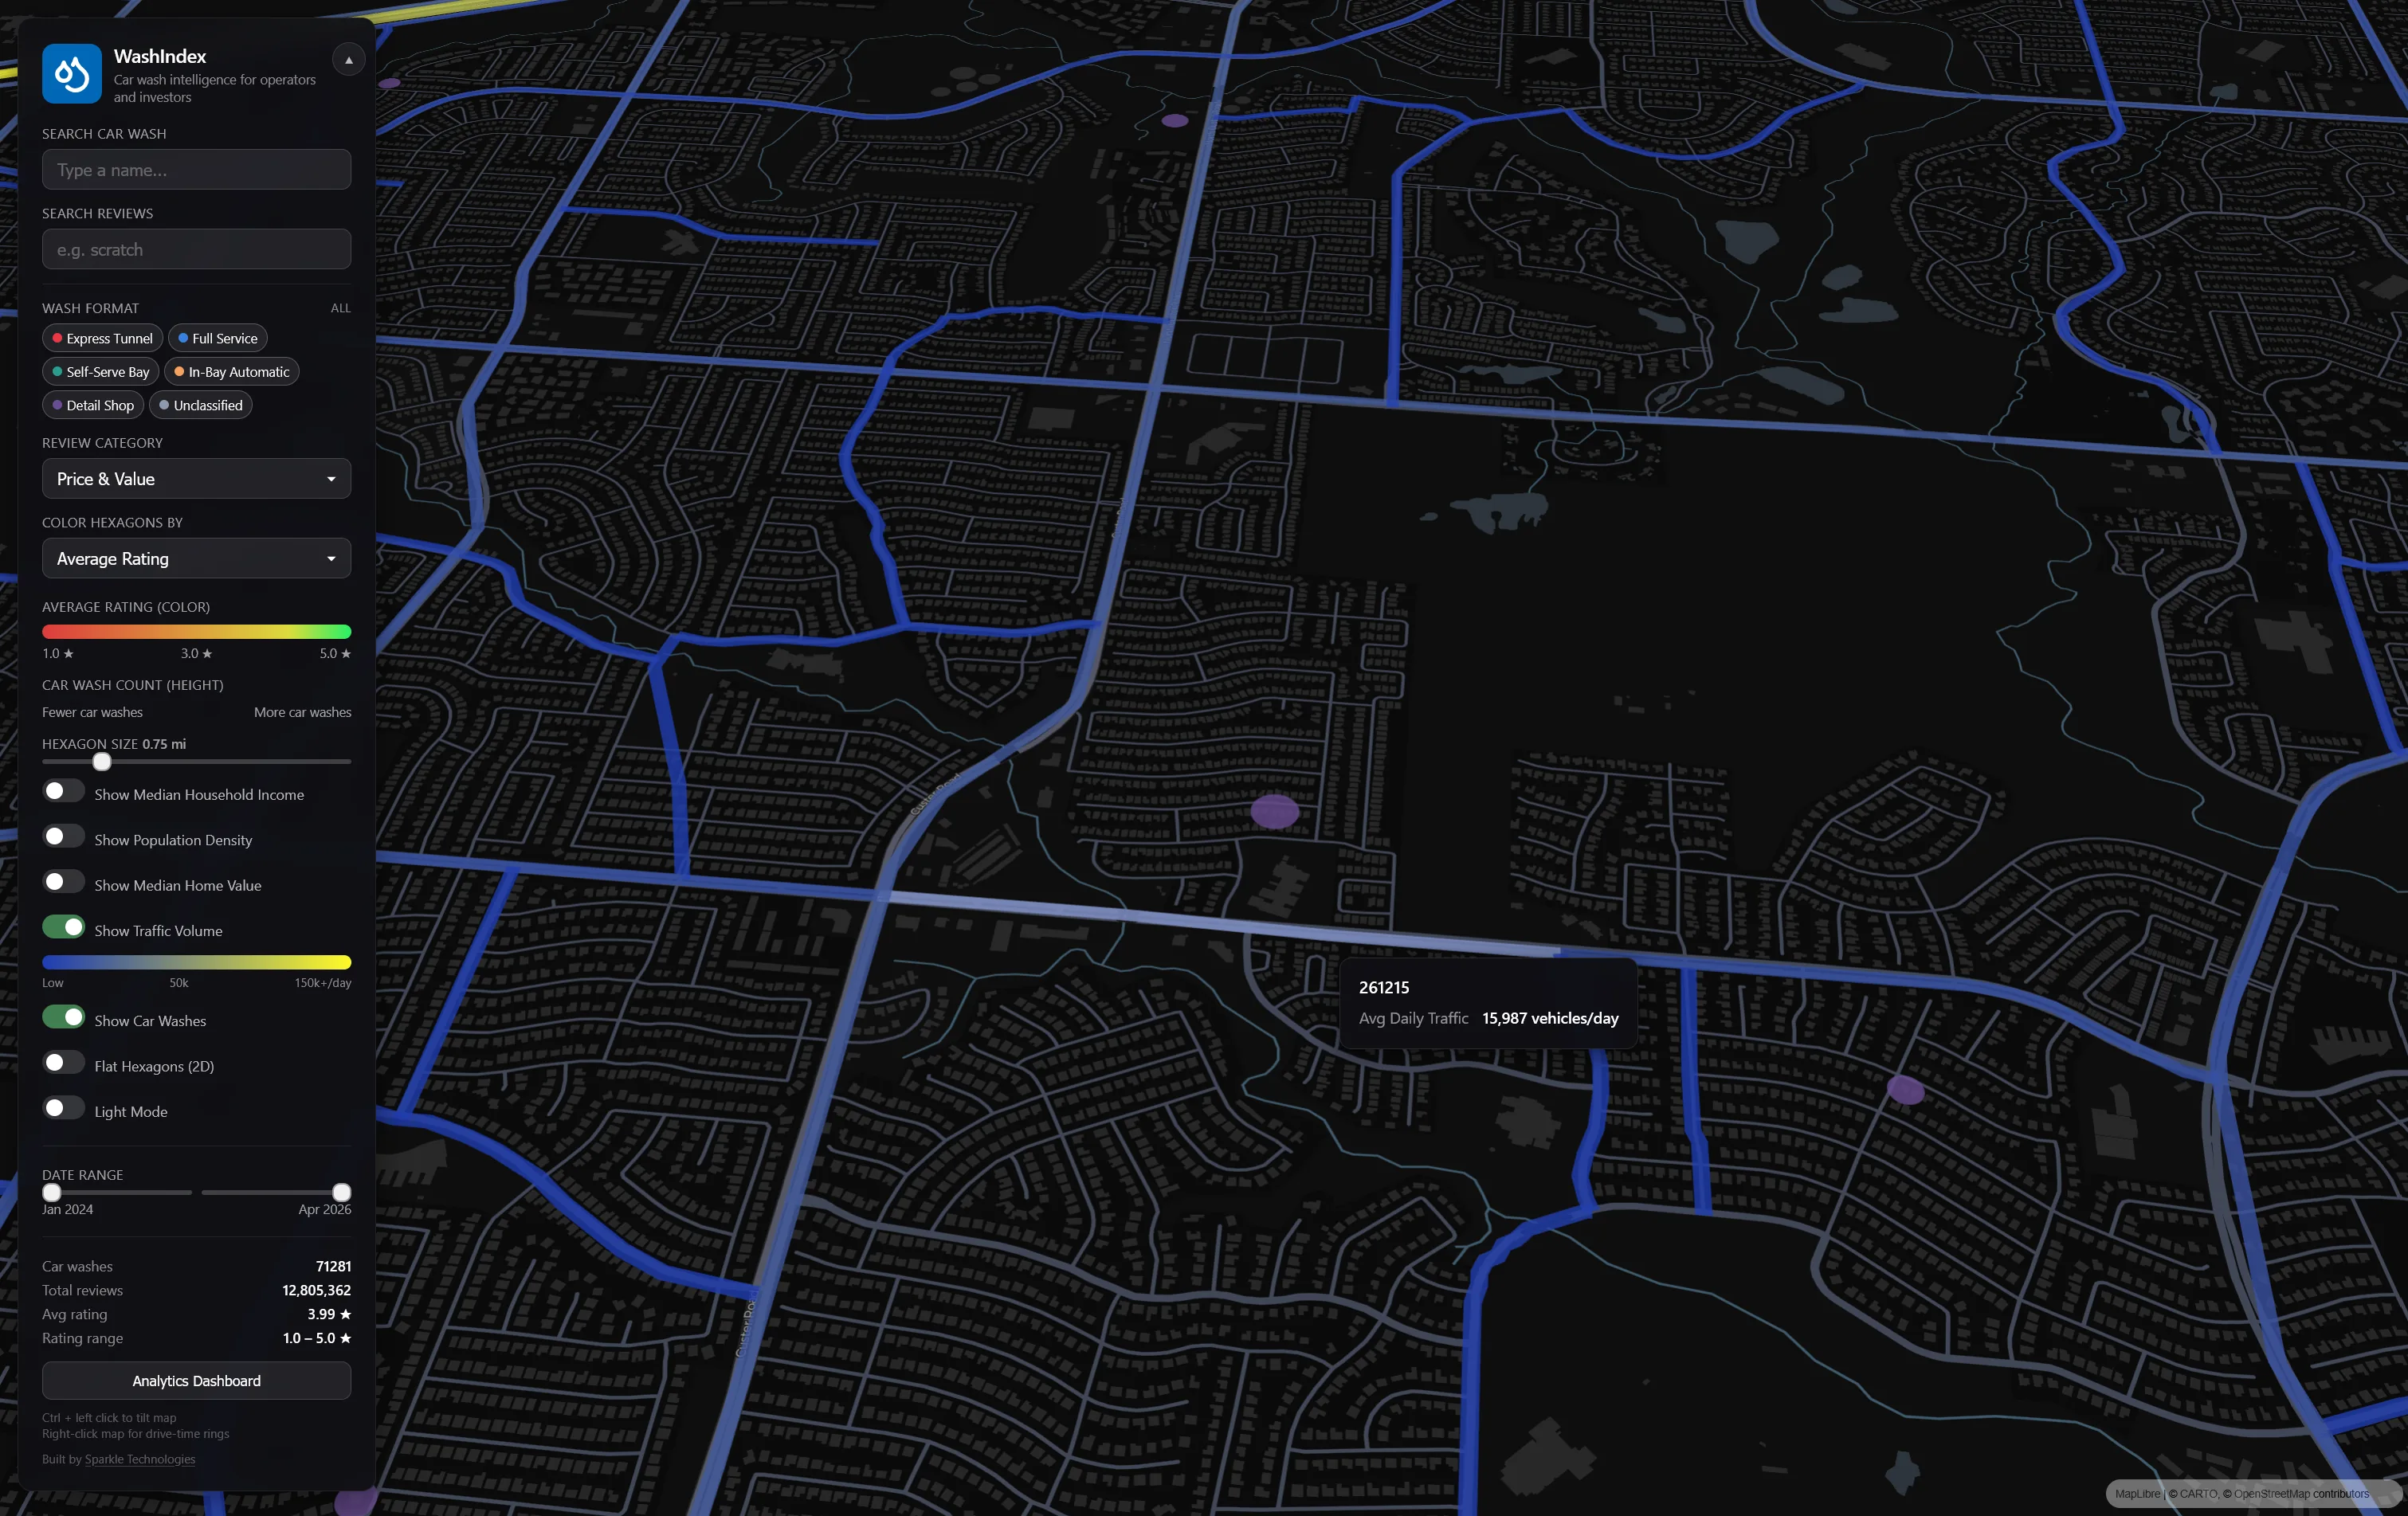
Combine these layers and you can answer questions that used to require hiring a site selection consultant: ‘Where are the high-income, high-traffic areas with low car wash density?’ Or: ‘Is this stretch of highway as busy as we think it is?’
The Opportunity Score
This is where all the data converges into a single actionable metric. The Opportunity Score is a composite index that combines population density, household income, home values, local competition, and existing review ratings into one number for each area on the map.
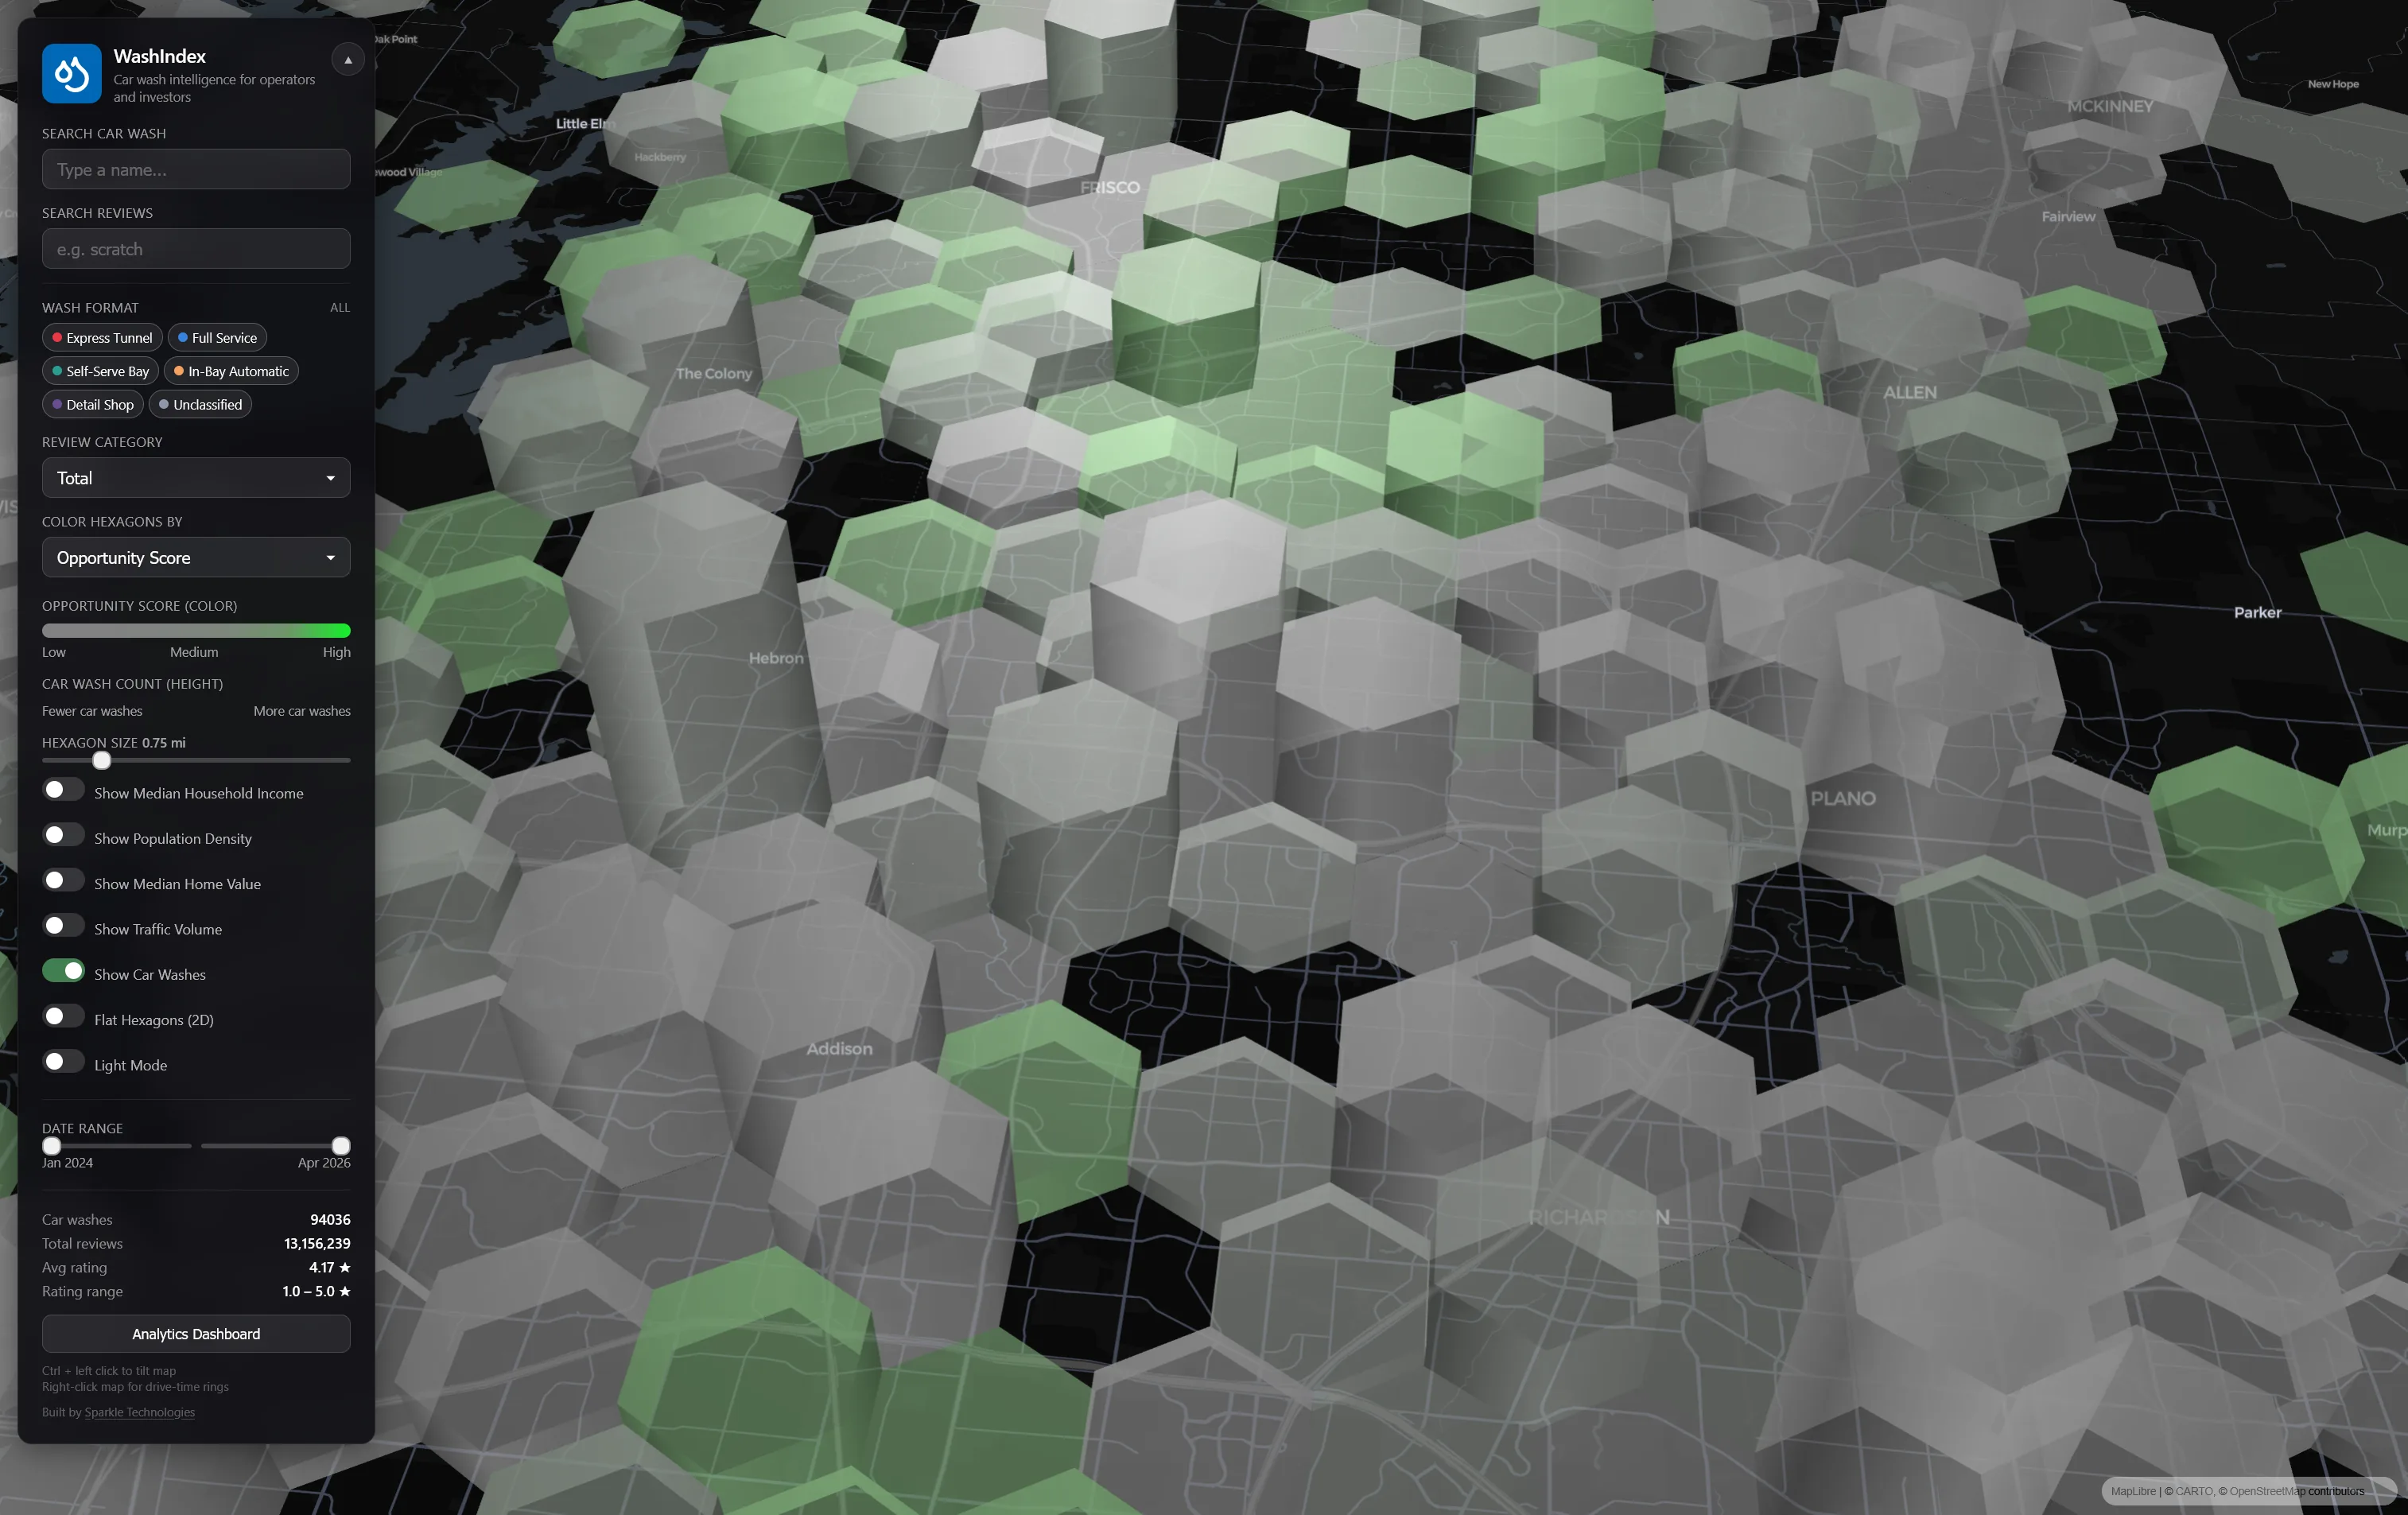
Switch the hexagon coloring to Opportunity Score and the map lights up differently. The brightest green areas are the sweet spots — strong demographics, solid traffic, but either no car washes nearby or ones with poor ratings. These are the gaps in the market, the areas where a well-run new location is most likely to thrive.
The Opportunity Score doesn’t tell you where to build. It tells you where to look — and it eliminates the 90% of the map where the fundamentals don’t support a new location.
Drive-time analysis
Site selection ultimately comes down to drive time, not straight-line distance. Right-click anywhere on the map and the platform generates 5-, 10-, and 15-minute drive-time isochrones using real road-network routing. These are irregular, organic shapes that follow actual roads and account for highway access, intersections, and traffic patterns — not the simple radius circles you get from most mapping tools.
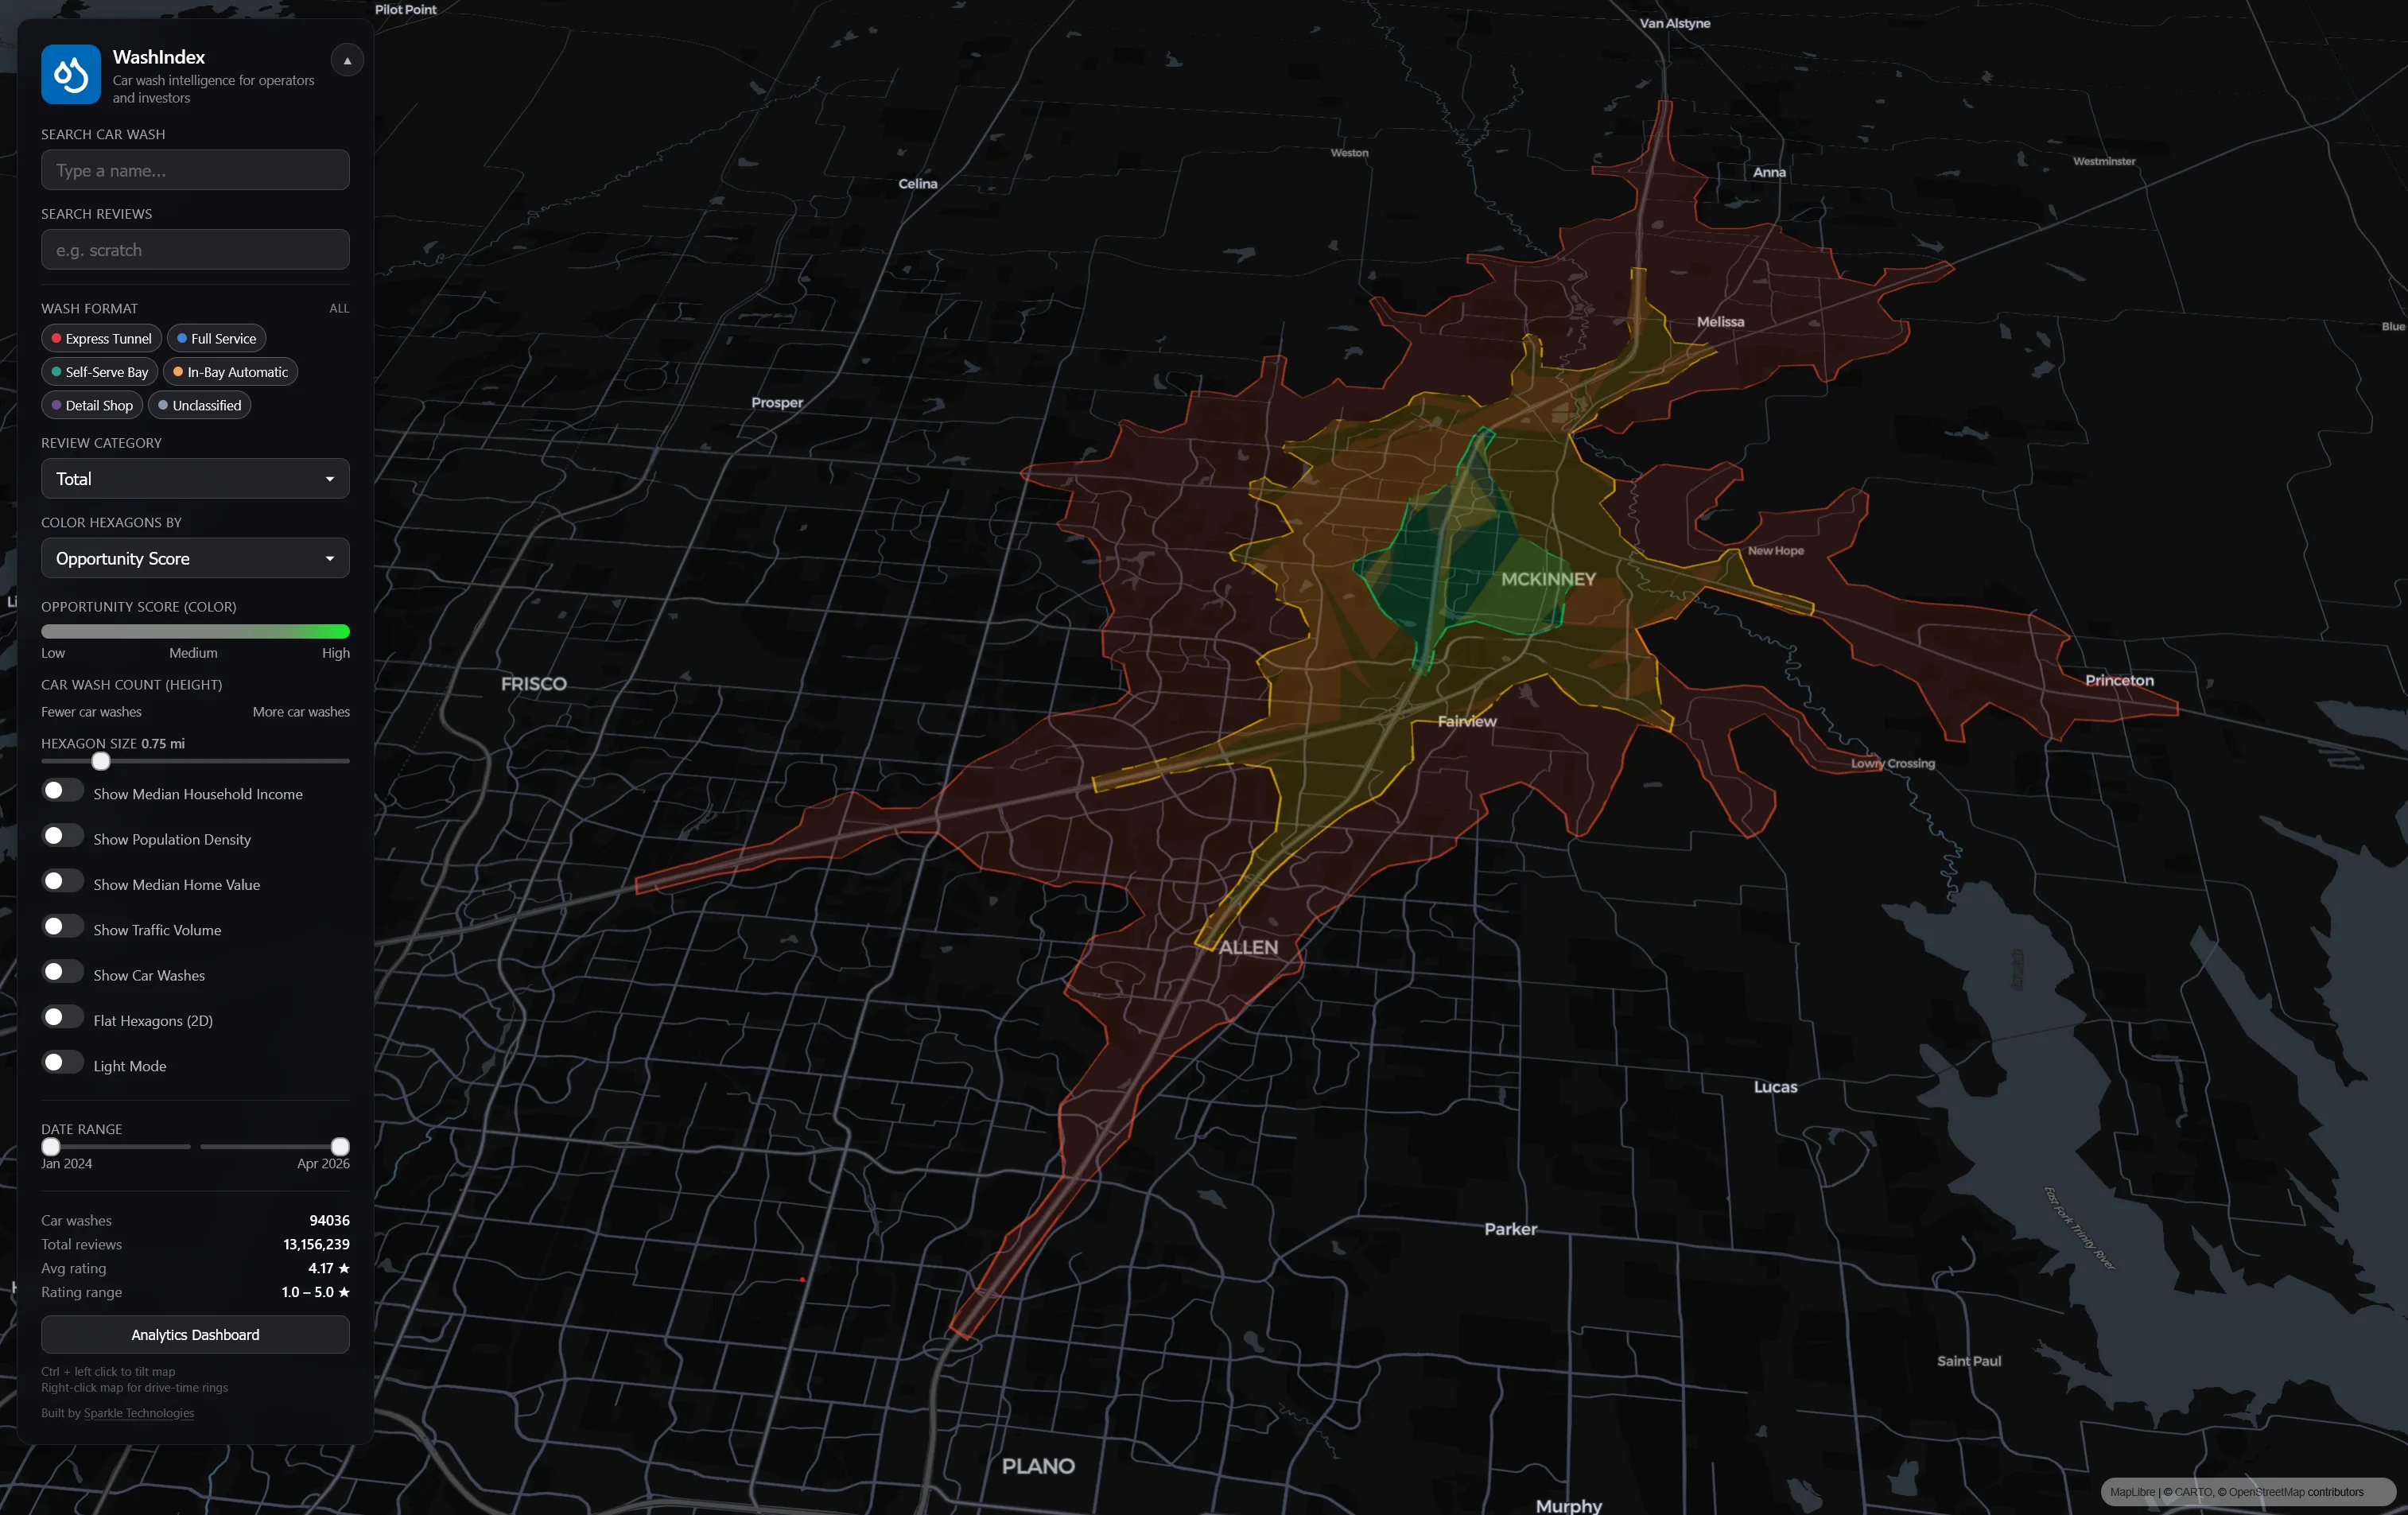
This lets you define the true trade area for any prospective or existing site. How many competitors fall within a 10-minute drive? What’s the population base within 15 minutes? Overlay the demographic and traffic data and you have a complete site profile without ever leaving the platform.
Full-text review search
Sometimes you need to go granular. The review search lets you query across all 12M+ reviews for any keyword or phrase. Type ‘scratch’ and the map updates to show only locations where customers mentioned scratches — sized and colored by the number of matching reviews. Type ‘membership’ to see where subscription programs are being discussed. Type ‘wait’ to find the pain points around speed.
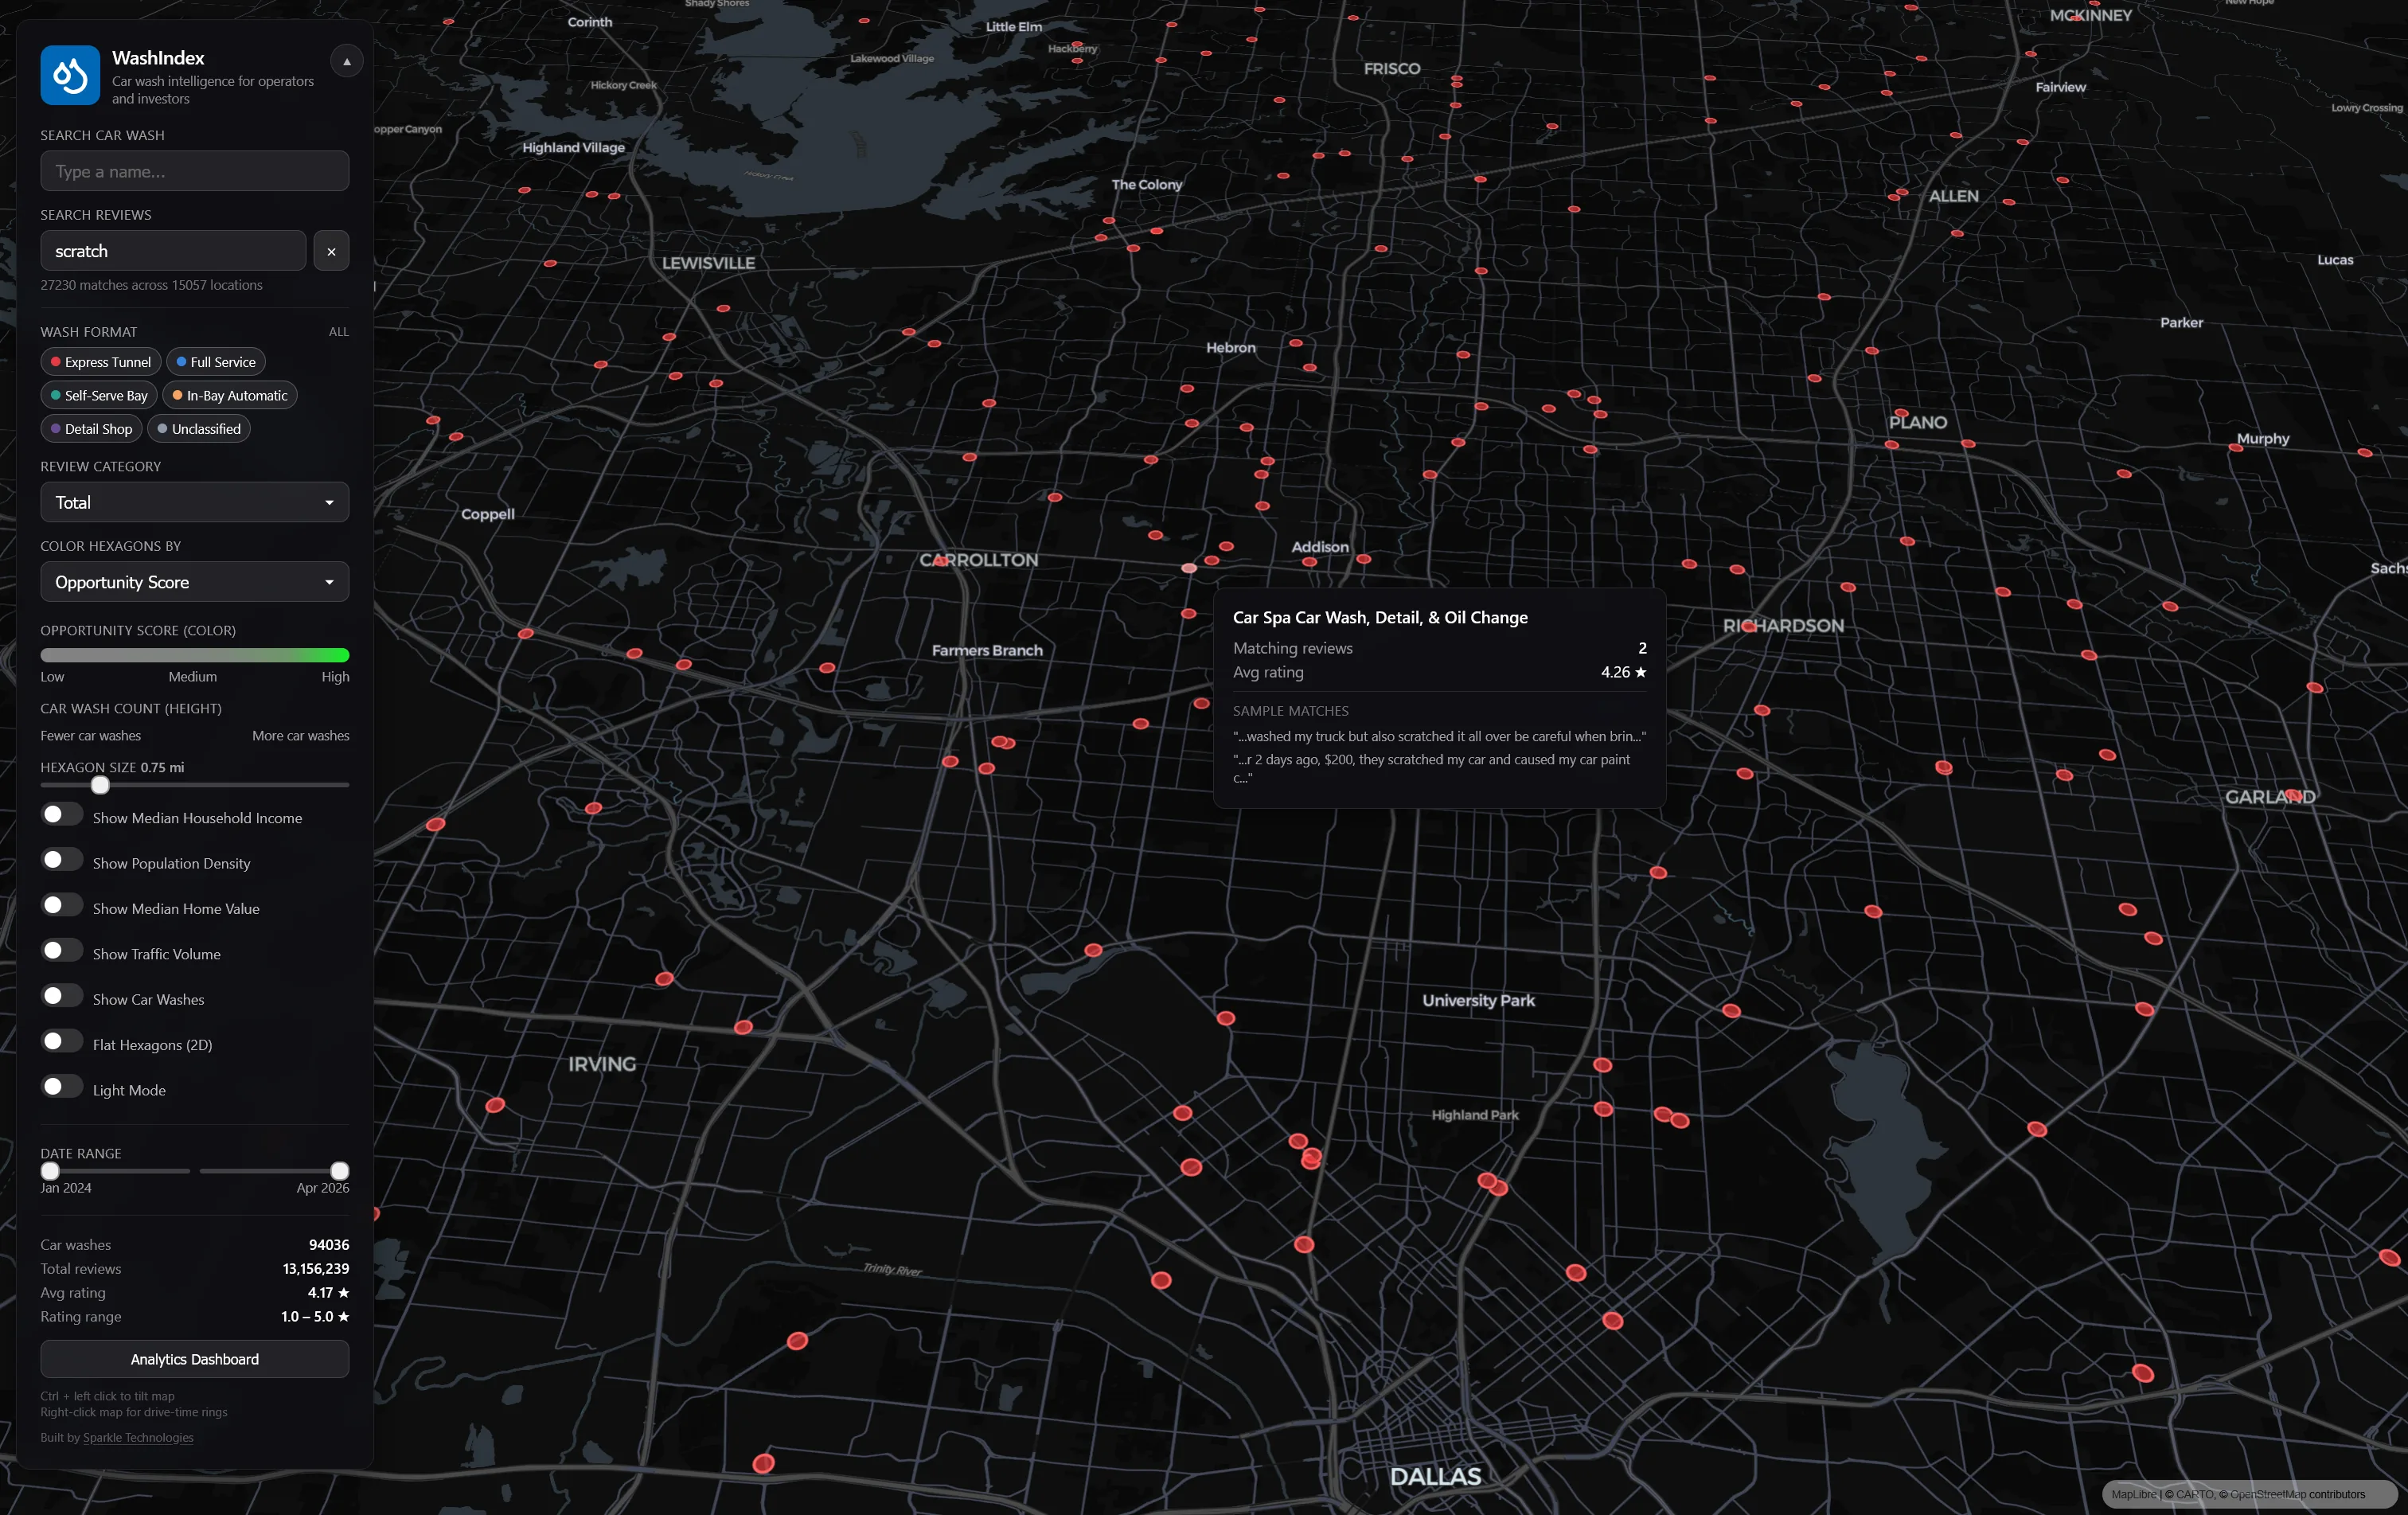
Click any highlighted location and a panel opens with the matching reviews, each one showing the full text with your keyword highlighted in context. You can read what customers are actually saying, not just what their star rating implies.
For operators doing competitive intelligence or tracking specific operational issues across a market, this turns what would be weeks of manual review-reading into a 30-second search.
Search by name
Need to find a specific brand or location? The search bar supports instant lookup by car wash name. Start typing and matching locations appear with their rating and review count. Select one and the map flies to that location.
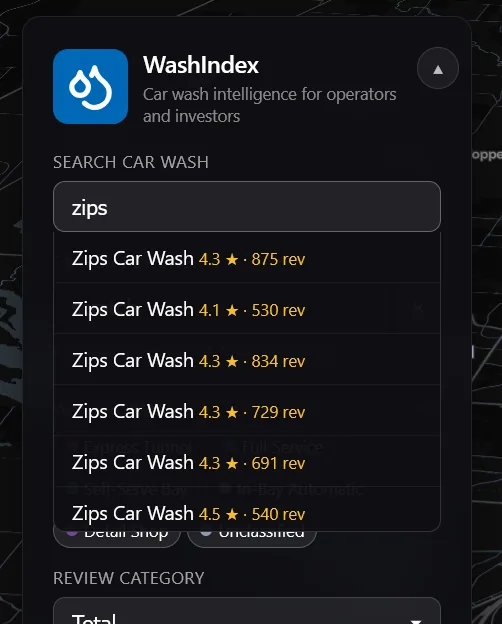
This is especially useful for chain operators who want to benchmark all their locations against each other, or for investors evaluating a specific brand’s footprint across the country.
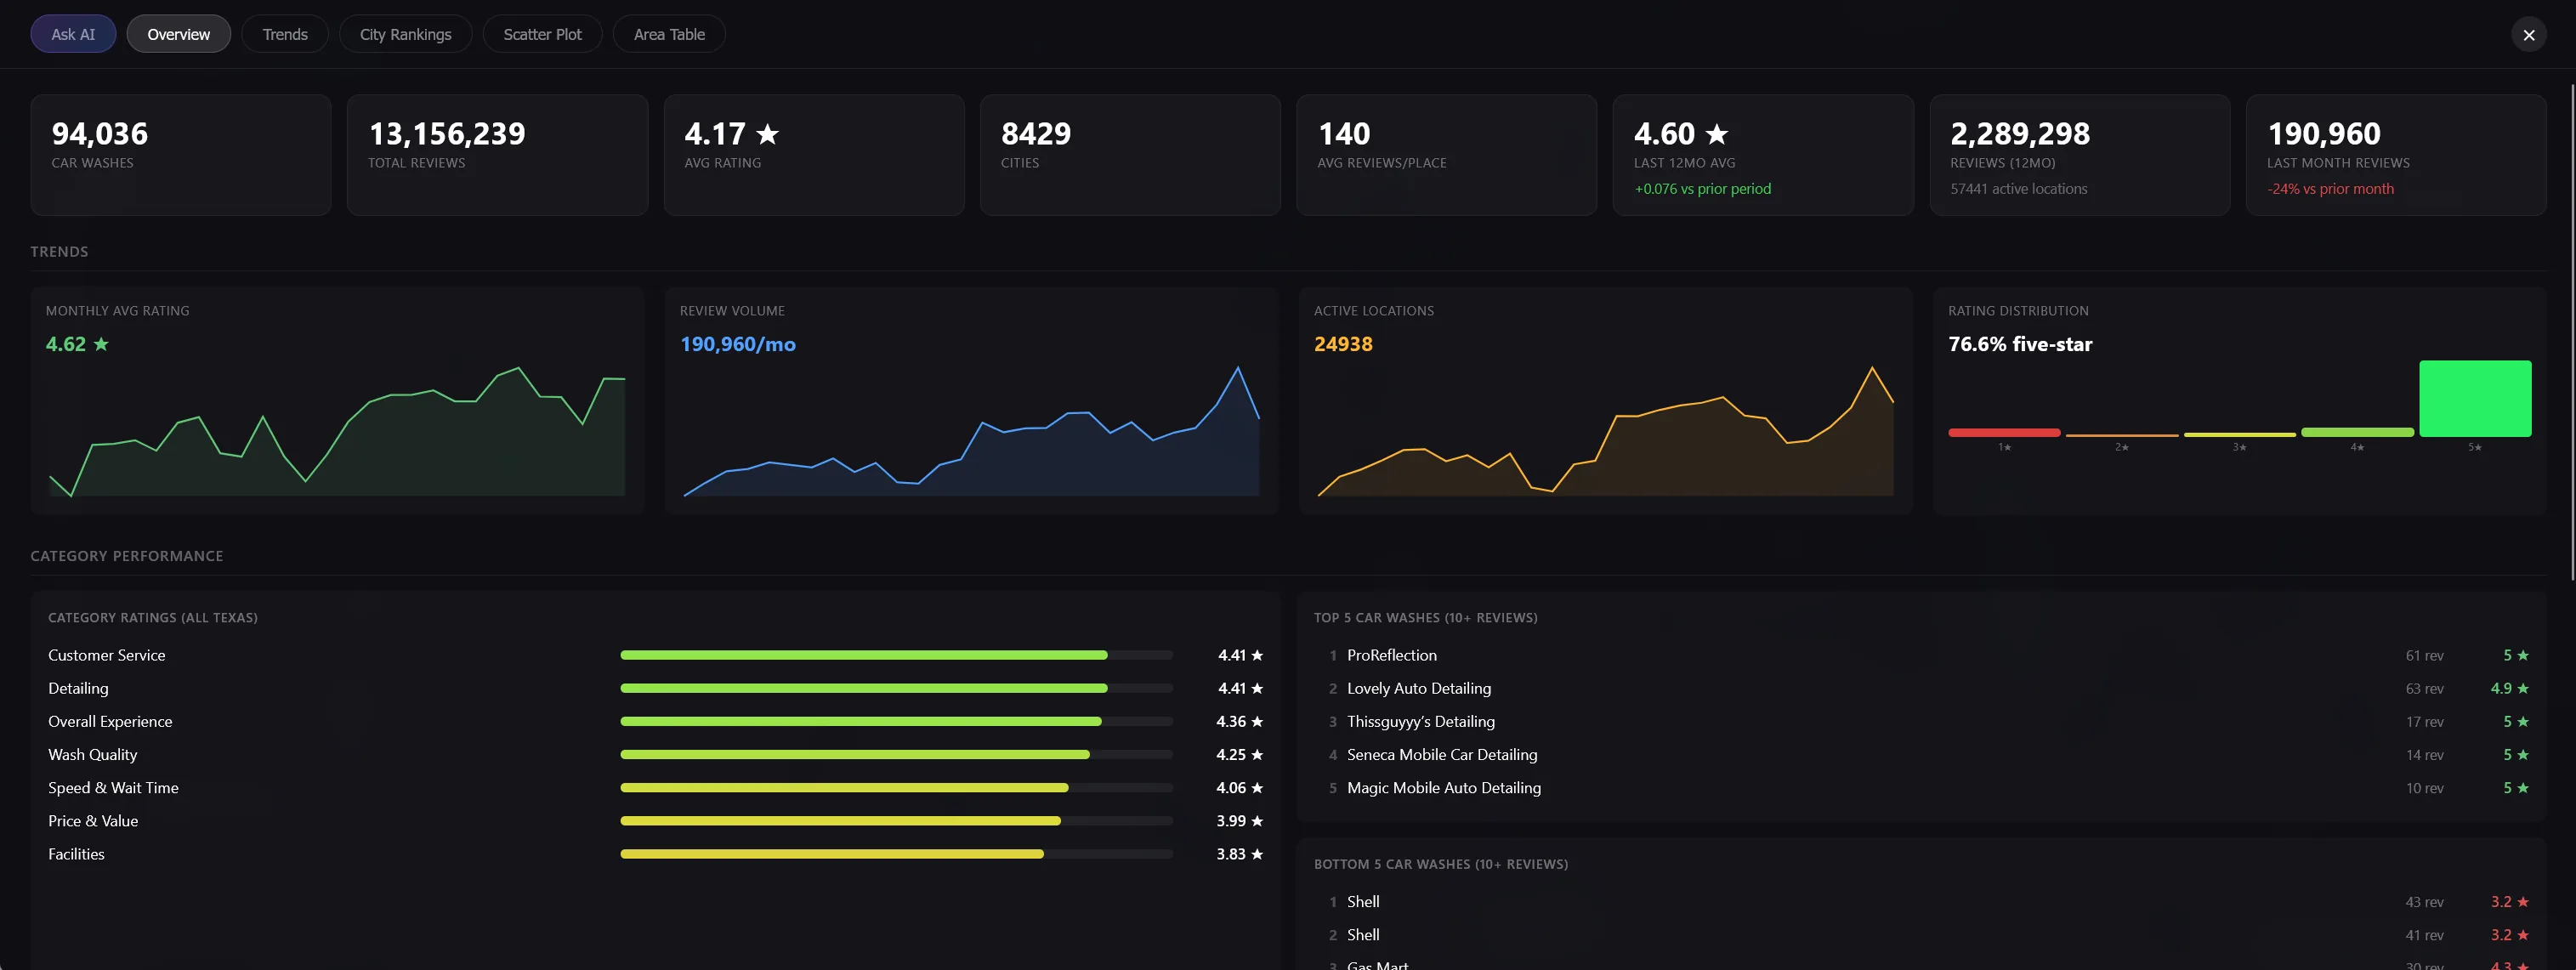
The analytics dashboard
Behind the map sits a comprehensive analytics dashboard with five tabs, designed for the kind of analysis that goes beyond point-and-click map exploration: an Overview with KPIs and trend sparklines, Trends with multi-city monthly rating charts, City Rankings showing the most improved, fastest-declining, and fastest-growing markets, a Scatter Plot for correlating any two variables (with r-values calculated automatically), and an Area Table for sortable cross-market comparisons.
Head-to-head benchmarking against the right competitors
Once a wash is classified and scored, the platform produces head-to-head benchmarks against the locations that actually matter. For every car wash in the country, you can see how it stacks up against:
- Other locations of the same format.
- Other locations within configurable drive-time isochrones (5, 10, or 15 minutes).
- Other locations in the same demographic cohort (income tier, density tier).
- Other locations in the same chain, where applicable.
On a single screen, an operator can see exactly how a location performs against its true competitive set on every pillar and every signal. A private-equity buyer can pull the same view across an acquisition target’s entire portfolio in seconds. A REIT team can compare cross-state holdings on identical criteria.
Ask AI: your on-demand analyst
The pre-built views and analytics tabs answer the questions we anticipated. But every user has their own questions — the ones specific to their portfolio, their trade area, their competitive set. That’s why we built Ask AI directly into the platform.
Click the ‘Ask AI’ button and a chat panel opens. You can ask anything about the dataset in plain English and get a detailed, data-driven answer in seconds. The model has access to the full review dataset, all the demographic data, and every metric on the platform. Think of it as an analyst who has read every single review across every car wash in the United States and can answer any question you throw at them.
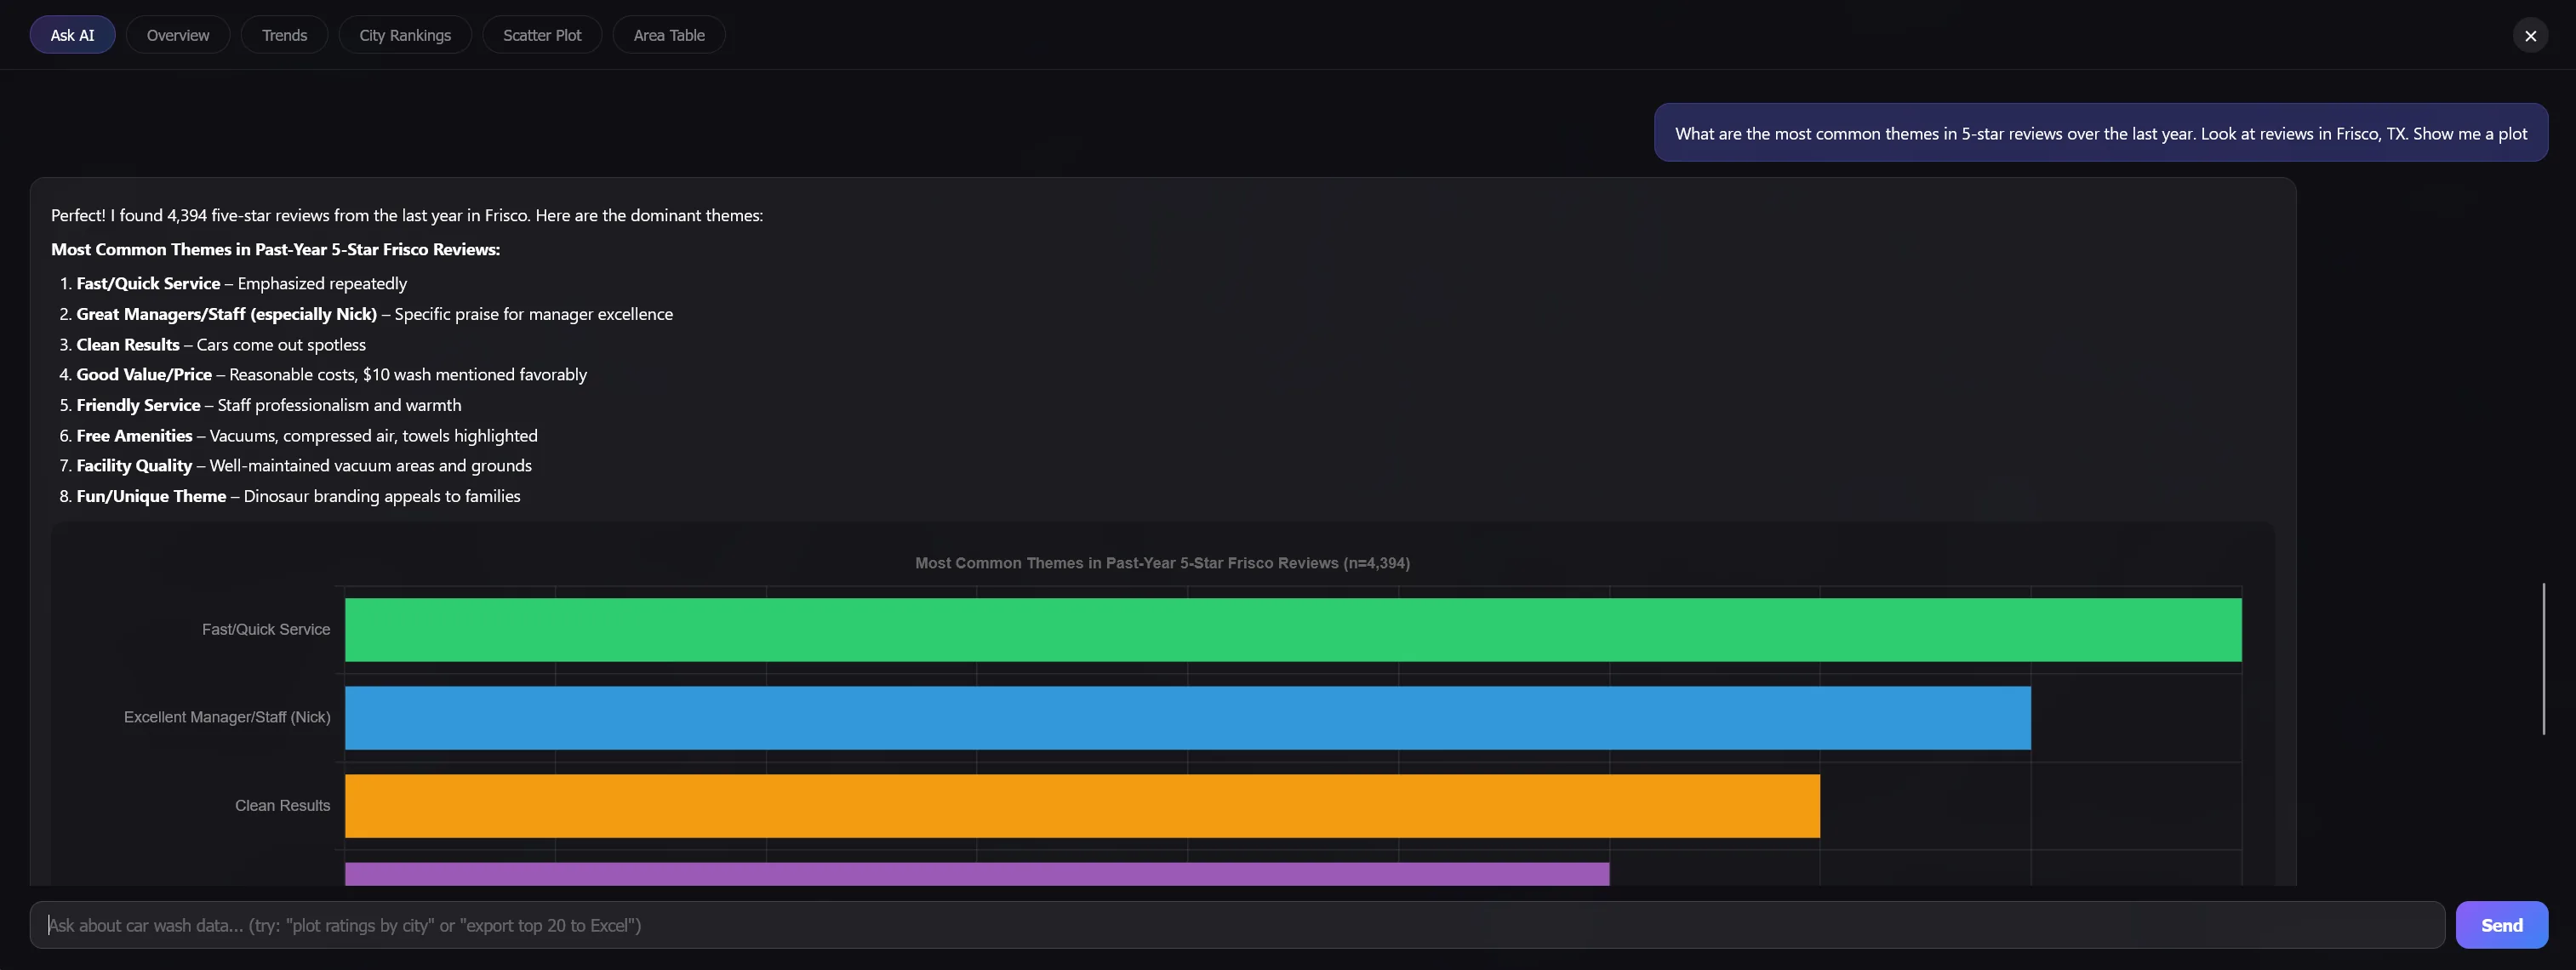
A few examples of the kinds of questions you can ask:
- Competitive Intelligence — ‘What do customers complain about at low-rated car washes?’
- Market Gaps — ‘Which cities are underserved by high-quality car washes?’
- Market Comparison — ‘Compare the Dallas vs. Fort Worth car wash markets.’
- Brand Analysis — ‘How do Mister Car Wash locations rate compared to independent operators?’
- Operational Insights — ‘What are the most common complaints about wait times in Houston?’
- Site Selection — ‘Which ZIP codes have high income but low car wash density?’
Answers come back as text, inline charts, and tables — and you can ask Ask AI to create an Excel file from the data.
Where it goes next
WashIndex v1.0 is live at platform.washindex.com. If you operate, invest in, or build car washes anywhere in the United States, the platform now has data on every property you might consider — and on every competitor in the trade area around it.
If you’d like a guided walkthrough of the data we have in your markets, or have custom questions you want answered, send us an email at contact@washindex.com.